Free CXC Additional Mathematics Paper 2 May/June 2025 past paper from 2025. Includes a worked answer key. Open the PDF, take a timed test, and study with AI on Caribbean AI.
Answer keys are free on Caribbean AI. View the answers to every past-paper question at no cost - no payment needed - with step-by-step worked solutions and instant AI marking available on Premium.
CSEC Additional Mathematics Paper 2 May/June 2025 - Free CXC Past Paper with Answers
Free CXC Additional Mathematics Paper 2 May/June 2025 past paper from 2025. Includes a worked answer key. Open the PDF, take a timed test, and study with AI on Caribbean AI.
Opening the interactive papers…
Every question from this paper as text. See the answers and worked solutions. Questions are the property of the Caribbean Examinations Council; Caribbean AI is not affiliated with CXC.
Solve the equation , giving your answer in exact form.
[4 marks]
Determine the values of and which satisfy the equations and .
[6 marks]
Determine the solution set for the inequality , giving your answer in set builder notation.
[4 marks]
State how the solution of would differ from the solution of .
[1 mark]
The relationship between two variables, and , is . Express the relationship in the form , where .
[4 marks]
Hence, state the value of the -intercept of a graph of versus .
[1 mark]
Determine whether the series is arithmetic or geometric. Justify your response.
[2 marks]
In a geometric progression, the 3rd term is 25 and the sum of the 1st and 2nd terms is 500. Find the common ratio where .
[4 marks]
A kitchen garden has an area, , . The length of the garden is . Determine the value of , if the width of the garden, in metres, is in the form , where is a real number.
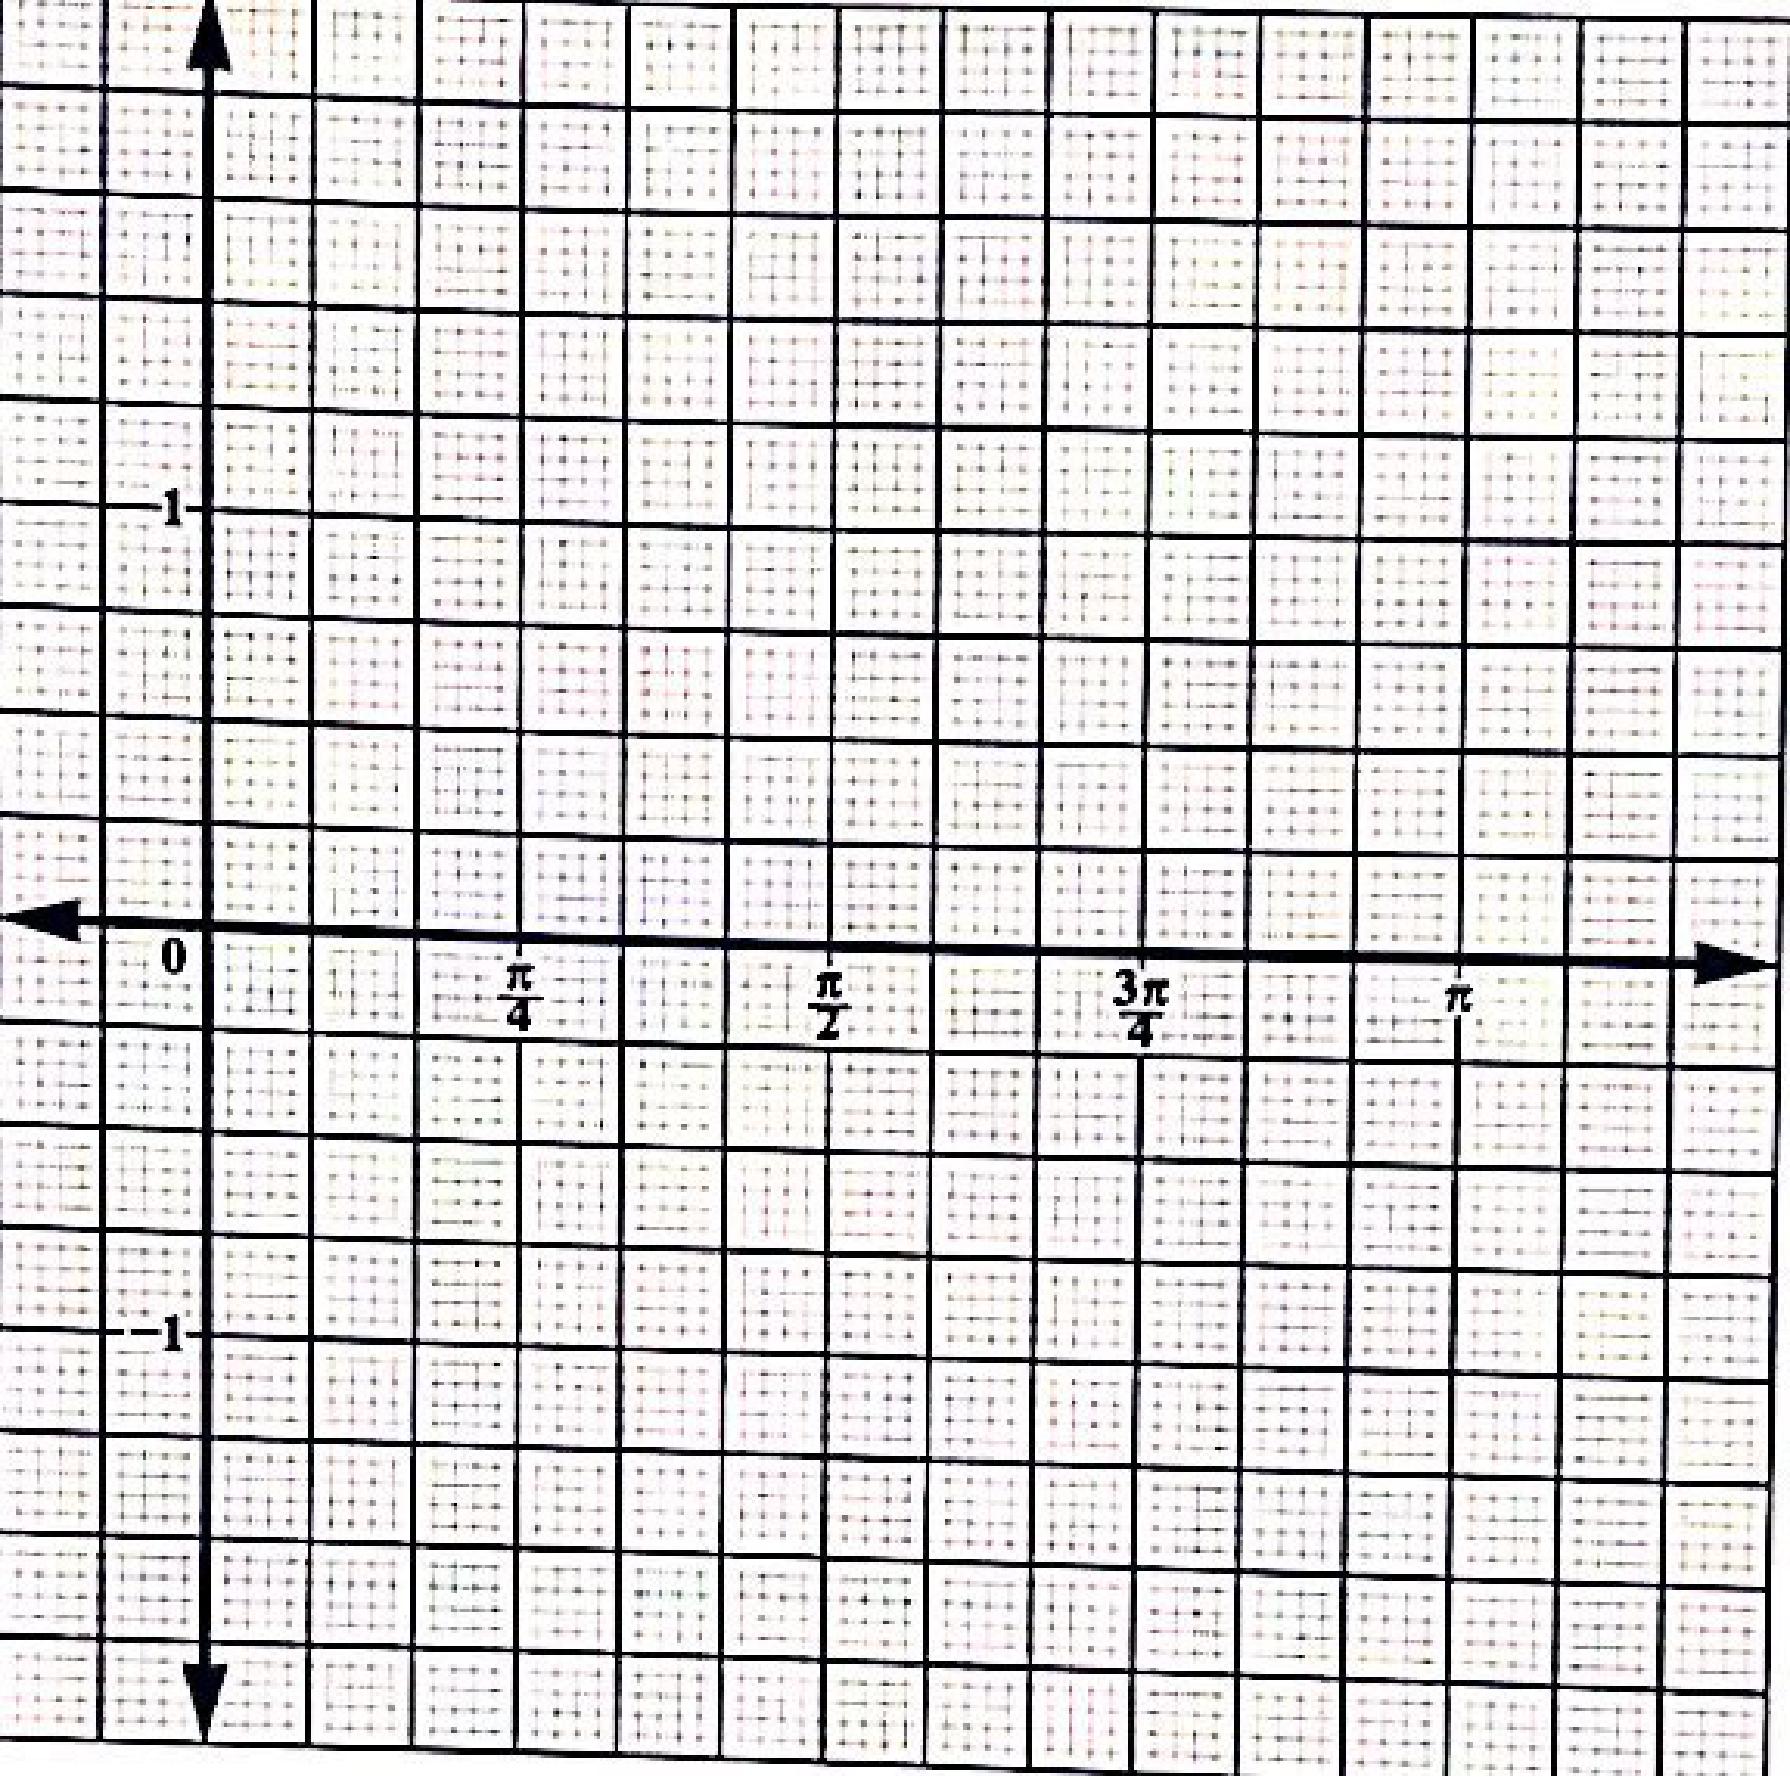
Using the grid on page 11, draw the graphs of and , for .
[2 marks]
Hence or otherwise, solve the equation for .
[4 marks]
Using an appropriate double-angle formula, derive the identity for .
[2 marks]
Hence, prove the identity .
The position vectors of two points, and , whose coordinates are and respectively are relative to an origin, .
Express the unit vector in terms of .
[4 marks]
Find the angle , in degrees.
[3 marks]
Hence, state the relationship between the vectors and .
Differentiate the following expression with respect to , simplifying your answer.
[3 marks]
Determine the coordinates of all the stationary points of the curve .
Hence, determine the nature of EACH of the stationary points found in (b) (i).
[3 marks]
The length of each edge of a cube is increasing at a rate of . Calculate the rate of change of the volume of the cube at the instant when the length is .
[5 marks]
Determine
Determine
[3 marks]
.
[3 marks]
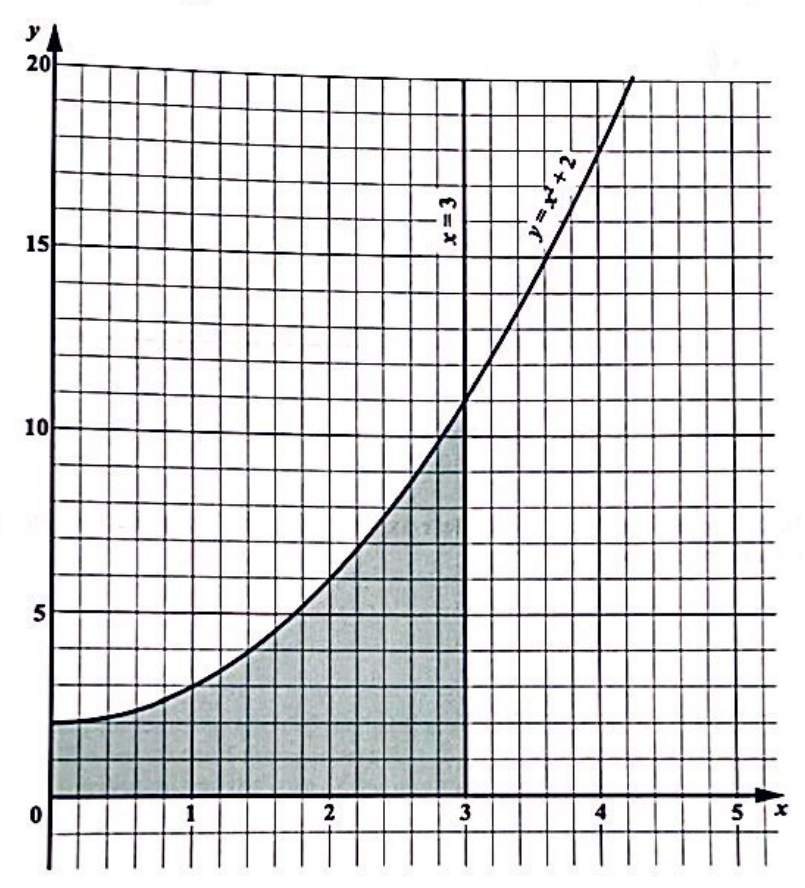
Figure 1 shows the region enclosed between the -axis, the -axis, the curve and the line .
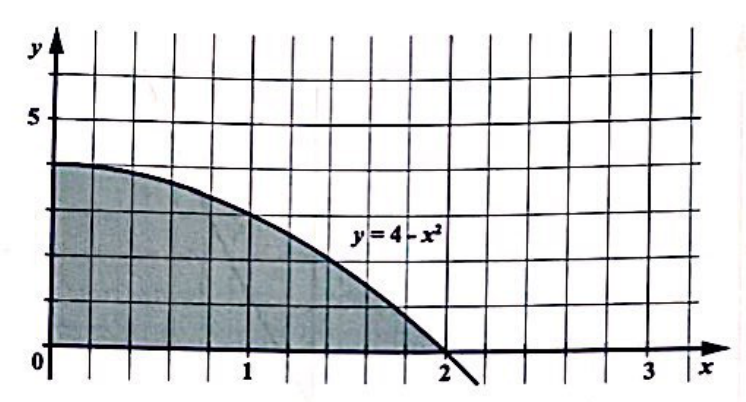
Figure 2 shows the shaded region enclosed between the -axis, the -axis and the curve .
If the region is rotated about the -axis through one complete revolution, calculate the volume of the solid formed.
SECTION IV
PROBABILITY AND STATISTICS
ALL working MUST be clearly shown.
[15 marks]
ALL working MUST be clearly shown.
If , and , calculate .
[5 marks]
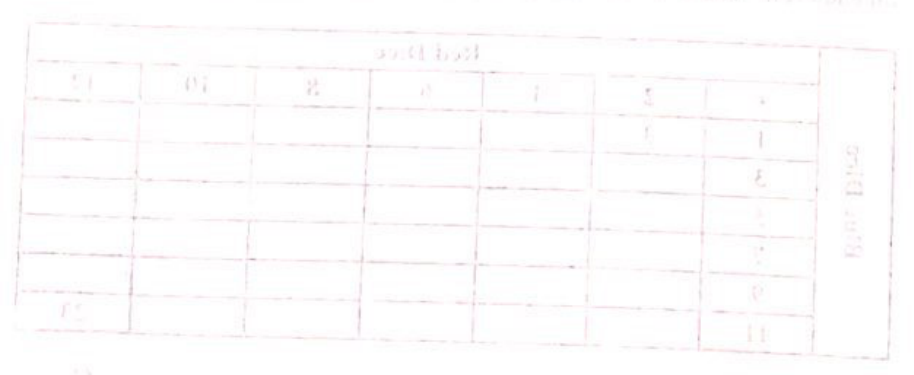
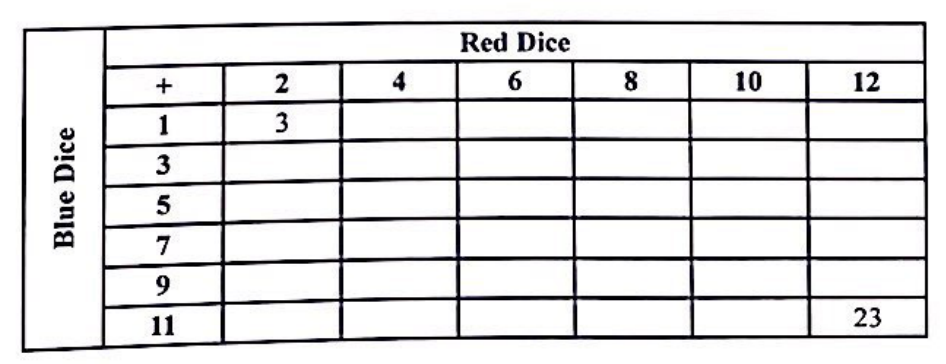
A fair, blue dice has each of the numbers 1, 3, 5, 7, 9 and 11 on its faces. A second, fair, red dice has each of the numbers 2, 4, 6, 8, 10 and 12 on its faces. The dice are rolled simultaneously and the sum of the numbers on their faces is recorded.
Complete the possibility space table below by inserting the sum of the two dice on each roll. The first sum and the last sum have been inserted for you.
| + | 2 | 4 | 6 | 8 | 10 | 12 |
|---|---|---|---|---|---|---|
| 1 | 3 | |||||
| 3 | ||||||
| 5 | ||||||
| 7 | ||||||
| 9 | ||||||
| 11 | 23 |
[3 marks]
Complete the possibility space table below by inserting the sum of the two dice on each roll. The first sum and the last sum have been inserted for you.
| + | 2 | 4 | 6 | 8 | 10 | 12 |
|---|---|---|---|---|---|---|
| Blue Dice | ||||||
| 1 | 3 | |||||
| 3 | ||||||
| 5 | ||||||
| 7 | ||||||
| 9 | ||||||
| 11 | 23 |
[3 marks]
State the probability that the sum of the scores from throwing the dice at (b) (i) is
[2 marks]
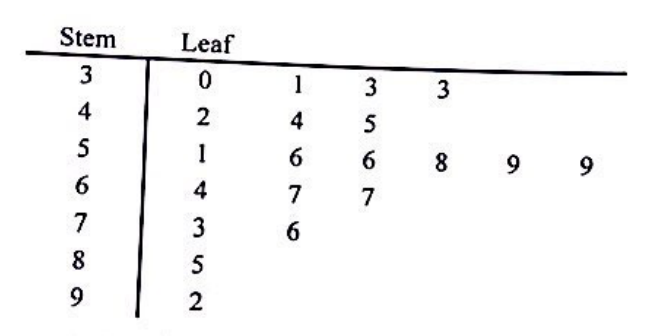
Calculate the interquartile range of the data set represented in the stem-and-leaf diagram below.
| Stem | Leaf |
|---|---|
| 3 | 1 3 |
| 4 | 2 4 5 |
| 5 | 1 6 6 8 9 |
| 6 | 4 7 7 |
| 7 | 3 6 |
| 8 | 5 |
| 9 | 2 |
Key: 3|0 means 30
[3 marks]
Figure 3 shows a box-and-whisker plot which represents a set of numerical data.
State the median of the data set.
[1 mark]
Determine the range of the data set.
[1 mark]
Describe the shape of the distribution.
[1 mark]
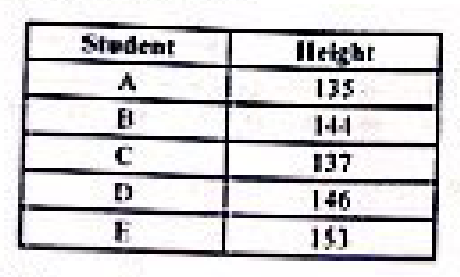
Five out of 30 students in a class were randomly selected and their heights recorded in centimetres as shown below.
| Student | Height |
|---|---|
| A | 135 |
| B | 140 |
| C | 137 |
| D | 146 |
| E | 151 |
Calculate the variance of their heights, in square centimetres.
[4 marks]
[4 marks]
[4 marks]
[8 marks]
[1 mark]
[4 marks]
Calculate the area of the shaded region.
[4 marks]
[5 marks]