Free CXC Additional Mathematics Paper 3 May/June 2014 past paper from 2014. Includes a worked answer key. Open the PDF, take a timed test, and study with AI on Caribbean AI.
Answer keys are free on Caribbean AI. View the answers to every past-paper question at no cost - no payment needed - with step-by-step worked solutions and instant AI marking available on Premium.
CSEC Additional Mathematics Paper 3 May/June 2014 - Free CXC Past Paper with Answers
Free CXC Additional Mathematics Paper 3 May/June 2014 past paper from 2014. Includes a worked answer key. Open the PDF, take a timed test, and study with AI on Caribbean AI.
Opening the interactive papers…
Every question from this paper as text. See the answers and worked solutions. Questions are the property of the Caribbean Examinations Council; Caribbean AI is not affiliated with CXC.
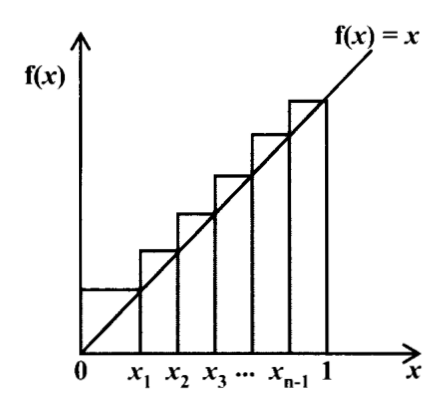
A student has to compute the area under the graph of a function. He reasons that he can do so by subdividing the area into an infinitely large number of rectangles. To help himself, he investigates by finding the area under the graph of the function over the interval , using the method of circumscribed rectangles as shown in Figure 1.
The student subdivides the interval into equal subintervals. Calculate the width, , of each subinterval.
[1 mark]
Let the points of subdivision be , , , ..., , as shown in Figure 1.
Find the values of , , ..., in terms of .
[1 mark]
Determine the heights , , ..., of the circumscribed rectangles over each of the respective subintervals.
[2 marks]
Determine the area , , , ..., of the respective circumscribed rectangles.
[2 marks]
Show that the sum, , of the areas of these circumscribed rectangles is given by
.
(Hint: You will need to evaluate the sum of a series. State any theorem used.)
[3 marks]
Compute for and , giving your answers to three decimal places.
[2 marks]
What number does approach as gets larger?
[1 mark]
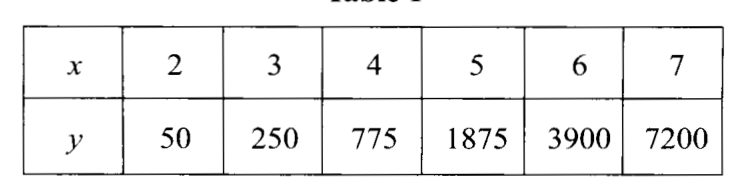
The variables and are related by a law of the form , where and are integers. The approximate values for , corresponding to the given values of are shown in Table 1.
| 2 | 3 | 4 | 5 | 6 | 7 | |
|---|---|---|---|---|---|---|
| 50 | 250 | 775 | 1875 | 3900 | 7200 |
Use logarithms to reduce this relation to a linear form, giving your values of and correct to two decimal places where appropriate.
[2 marks]
Using the graph paper provided and a scale of 2 cm to represent 0.1 units on the -axis, and 1 cm to represent 0.2 units on the -axis, plot a suitable straight line graph of against .
[2 marks]
Use your straight line graph to estimate the value of the constant and the value of the constant .
[4 marks]