Free CXC Mathematics Paper 3 May/June 2026 past paper from 2026. Includes a worked answer key. Open the PDF, take a timed test, and study with AI on Caribbean AI.
Answer keys are free on Caribbean AI. View the answers to every past-paper question at no cost - no payment needed - with step-by-step worked solutions and instant AI marking available on Premium.
CSEC Mathematics Paper 3 May/June 2026 - Free CXC Past Paper with Answers
Free CXC Mathematics Paper 3 May/June 2026 past paper from 2026. Includes a worked answer key. Open the PDF, take a timed test, and study with AI on Caribbean AI.
Opening the interactive papers…
Every question from this paper as text. See the answers and worked solutions. Questions are the property of the Caribbean Examinations Council; Caribbean AI is not affiliated with CXC.
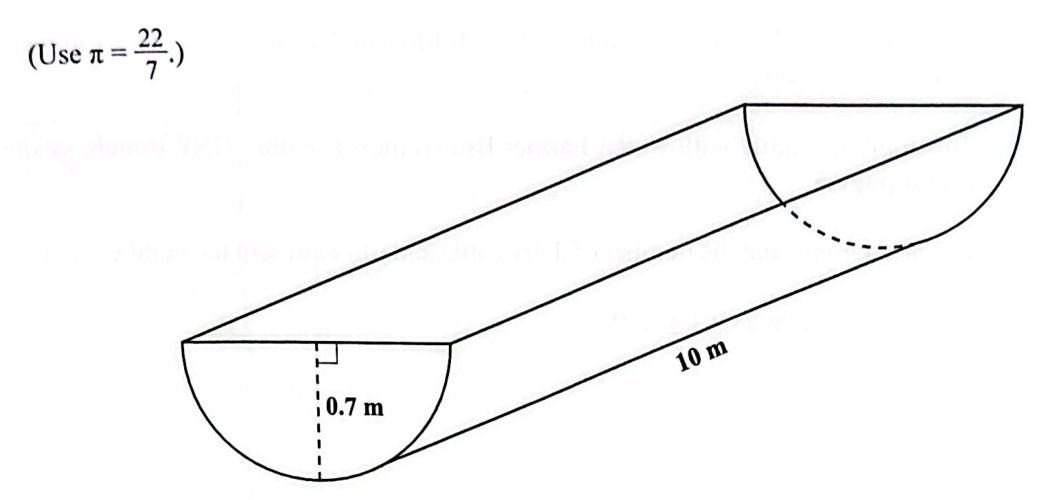
The diagram below shows a horizontal, semicylindrical-shaped trough with a uniform semicircular cross-section, which Farmer Brown wants to use to feed his cows. The radius of the semicircle is m and the length of the trough is m.
(Use )
A semicylindrical trough is shown.
Show that the capacity of the trough is cubic metres.
[2 marks]
Farmer Brown is setting up a cattle farm comprising cows for milk production (dairy cattle) and cows for beef production (beef cattle), and needs advice on the number of EACH type of cattle he MUST buy to maximize production.
The average daily water consumption is litres and litres for dairy cattle and beef cattle respectively.
To supply his cattle with water, Farmer Brown must use only ONE trough, as shown in (a) on page 5.
Using to represent the number of dairy cattle and to represent the number of beef cattle,
show that .
[2 marks]
Farmer Brown can have no more than cattle. Write an inequality in and to represent this constraint.
[1 mark]
Further, there must be AT LEAST dairy cattle and the number of beef cattle must be GREATER than but NOT exceed times the number of dairy cattle. In addition to the inequalities and , write the third inequality to represent the constraints above.
[1 mark]
On the graph below, the lines associated with of the inequalities are shown. The lines associated with of the inequalities are missing.
A Cartesian coordinate plane with x-axis from 0 to 160 and y-axis from 0 to 220. Lines are plotted:
(a) On the graph, construct the lines associated with the inequalities you wrote in (b)(ii) and (b)(iii) on page 6. (b) Shade, and label as R, the common region for all inequalities represented on the graph.
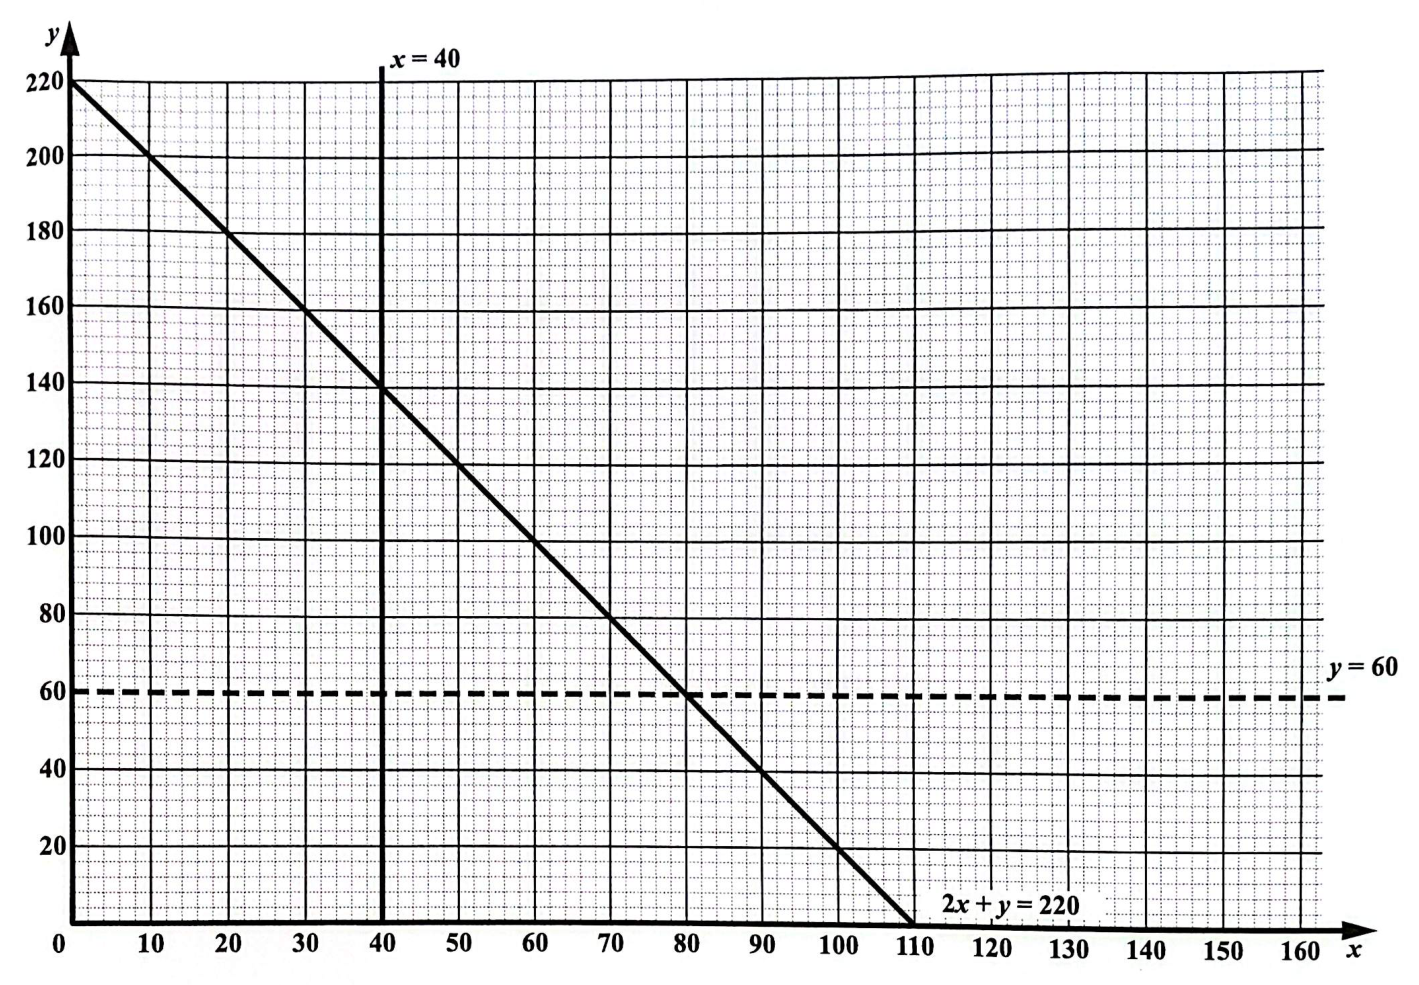
Based on the graph, suggest ONE of the possible combinations of the two types of cattle that Farmer Brown can use to set up his farm.
[1 mark]
The Triple S Cable Company is tracking the number of daily service desk calls it receives, in order to improve operational efficiency. At the end of each month, the data is collected, graphed and compared with previous months, to identify trends in fault reports and to develop improvement plans for the following month.
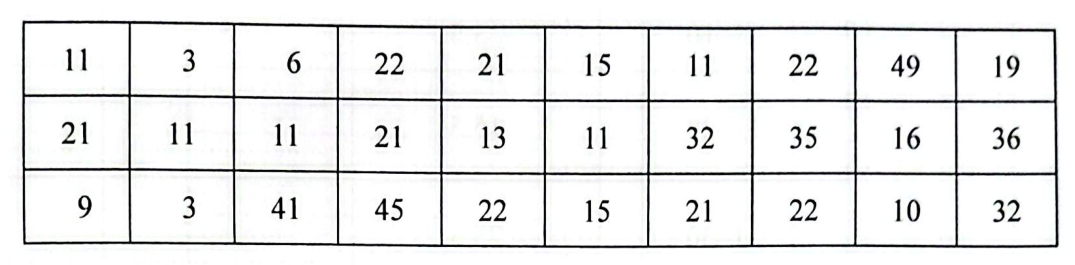
The following data set shows the number of calls received daily during the month of November.
| 11 | 3 | 6 | 22 | 21 | 15 | 11 | 22 | 49 | 19 |
|---|---|---|---|---|---|---|---|---|---|
| 21 | 11 | 11 | 21 | 13 | 11 | 32 | 35 | 16 | 36 |
| 9 | 3 | 41 | 45 | 22 | 15 | 21 | 22 | 10 | 32 |
You are required to answer the following questions which will provide details for the November report.
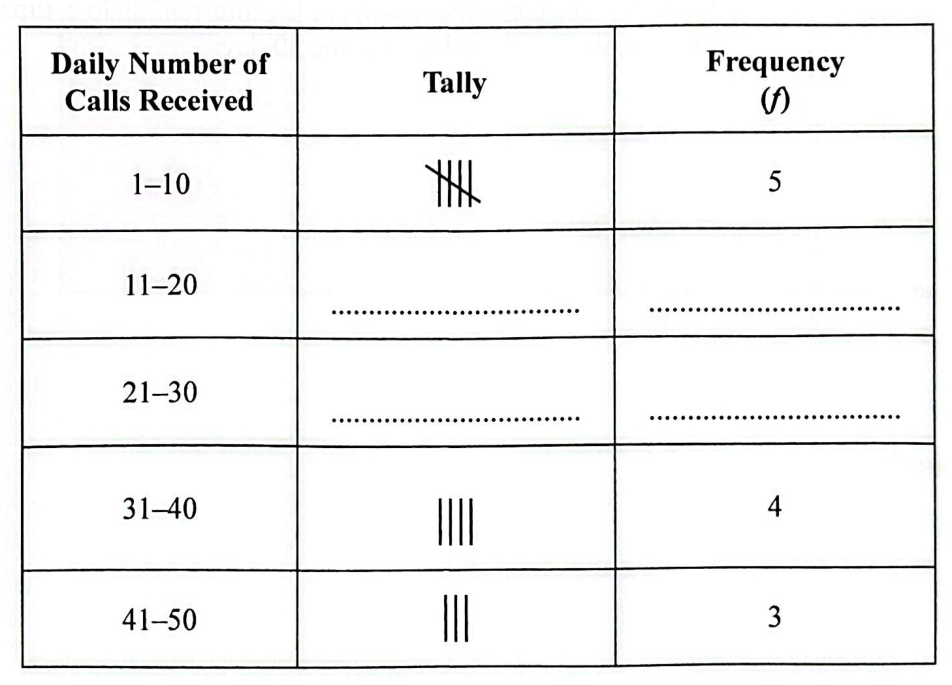
Complete the tally and frequency columns in the table below to represent the given information.
| Daily Number of Calls Received | Tally | Frequency () |
|---|---|---|
| 1–10 | $\text{ | |
| 11–20 | ||
| 21–30 | ||
| 31–40 | $\text{ | |
| 41–50 | $\text{ |
[2 marks]
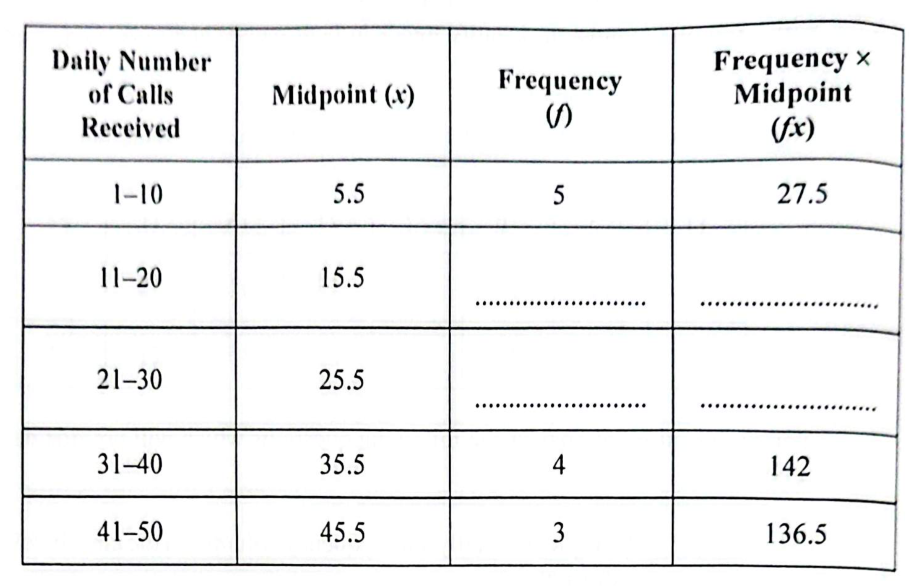
The table below shows the midpoints for the classes defined in (a) (i) on page 9.
| Daily Number of Calls Received | Midpoint () | Frequency () | Frequency Midpoint ($fx$) |
|---|---|---|---|
| 1–10 | 5.5 | 5 | 27.5 |
| 11–20 | 15.5 | ||
| 21–30 | 25.5 | ||
| 31–40 | 35.5 | 4 | 142 |
| 41–50 | 45.5 | 3 | 136.5 |
Complete the table above and use the information to estimate the average number of calls received per day over the 30 days.
[2 marks]
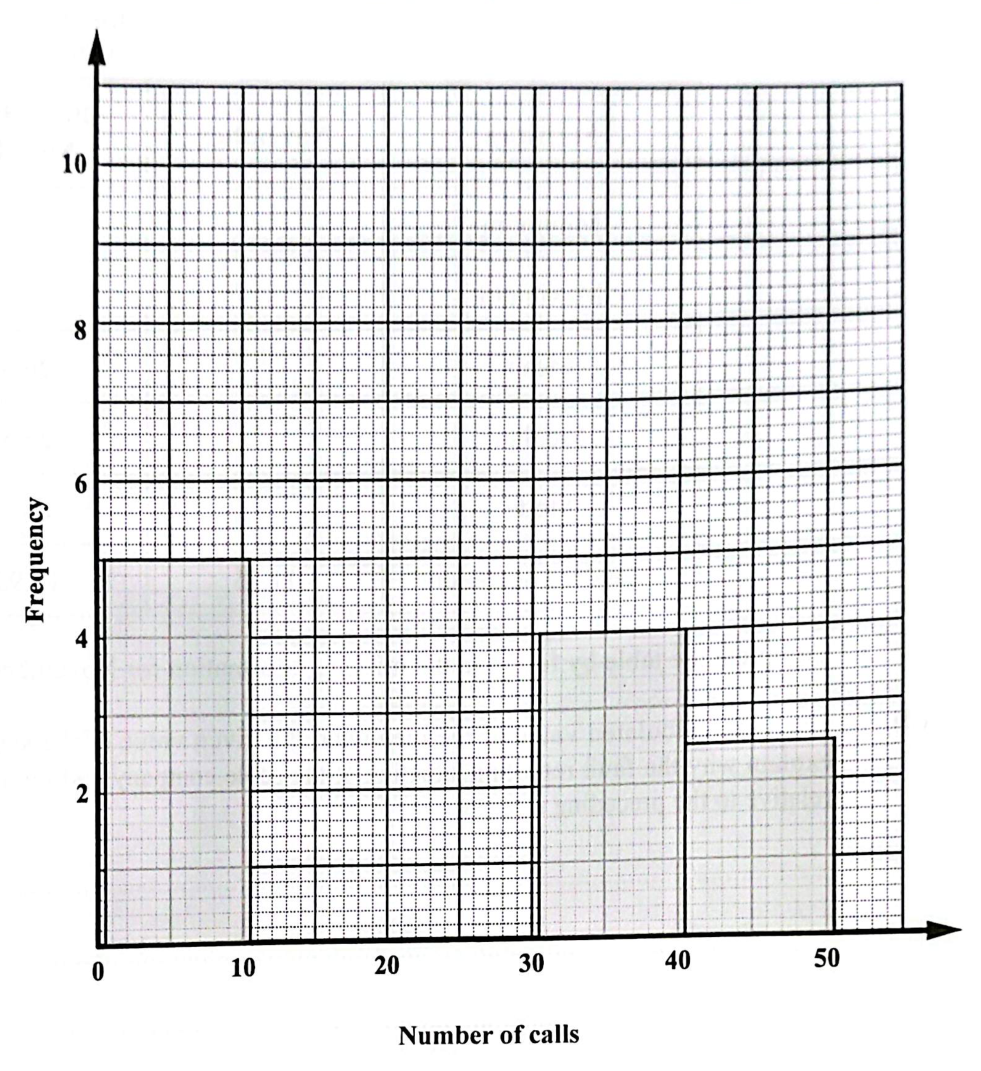
Complete the histogram below to graphically represent the data given on page 9.
[2 marks]
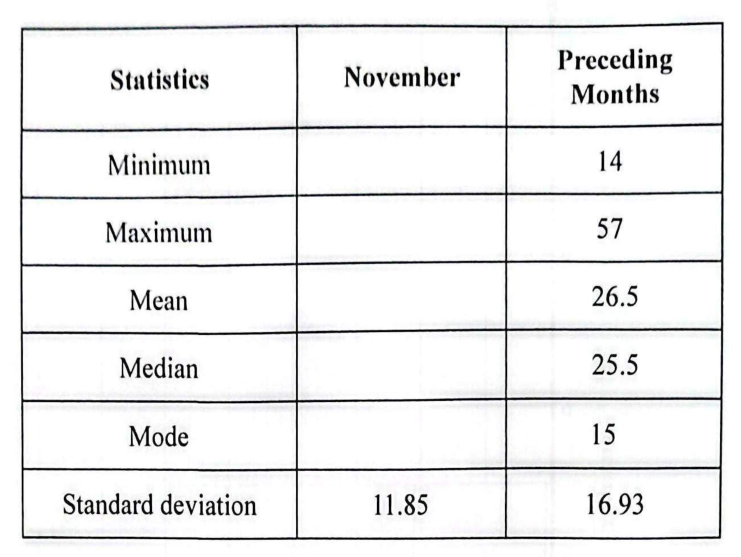
The table below shows the standard deviation for the number of daily calls received for the month of November and the average monthly statistics for the months preceding it.
| Statistics | November | Preceding Months |
|---|---|---|
| Minimum | 14 | |
| Maximum | 57 | |
| Mean | 26.5 | |
| Median | 25.5 | |
| Mode | 15 | |
| Standard deviation | 11.85 | 16.93 |
Complete the table by filling in the missing information for November.
[3 marks]
Use your calculated value of the mean and the given value of the standard deviation to explain why the fault reporting situation at the cable company had improved in November, relative to the preceding months.
[1 mark]