CSEC Biology Paper 3 May/June 2012 - Free CXC Past Paper with Answers
Free CXC Biology Paper 3 May/June 2012 past paper from 2012. Includes a worked answer key. Open the PDF, take a timed test, and study with AI on Caribbean AI.
Answer keys are free on Caribbean AI. View the answers to every past-paper question at no cost - no payment needed - with step-by-step worked solutions and instant AI marking available on Premium.
- All CSEC Past Papers
- CSEC Biology Past Papers
- CSEC Biology Paper 3 January 2020
- CSEC Biology Paper 3 May/June 2018
- CSEC Biology Paper 3 May/June 2017
- CSEC Biology Paper 3 May/June 2014
- CSEC Biology Paper 3 May/June 2013
- CSEC Biology Paper 3 May/June 2007
- CSEC Biology Paper 3 January 2007
- CSEC Biology Paper 3 May/June 2006
- CSEC Biology Paper 3 May/June 2005
- CSEC Biology Paper 3 January 2005
CSEC Biology Paper 3 May/June 2012 - Free CXC Past Paper with Answers
Free CXC Biology Paper 3 May/June 2012 past paper from 2012. Includes a worked answer key. Open the PDF, take a timed test, and study with AI on Caribbean AI.
Opening the interactive papers…
- All CSEC Past Papers
- CSEC Biology Past Papers
- CSEC Biology Paper 3 January 2020
- CSEC Biology Paper 3 May/June 2018
- CSEC Biology Paper 3 May/June 2017
- CSEC Biology Paper 3 May/June 2014
- CSEC Biology Paper 3 May/June 2013
- CSEC Biology Paper 3 May/June 2007
- CSEC Biology Paper 3 January 2007
- CSEC Biology Paper 3 May/June 2006
- CSEC Biology Paper 3 May/June 2005
- CSEC Biology Paper 3 January 2005
CSEC Biology Paper 3 May/June 2012 Questions
Every question from this paper as text. See the answers and worked solutions. Questions are the property of the Caribbean Examinations Council; Caribbean AI is not affiliated with CXC.
Question 1 (25 marks)
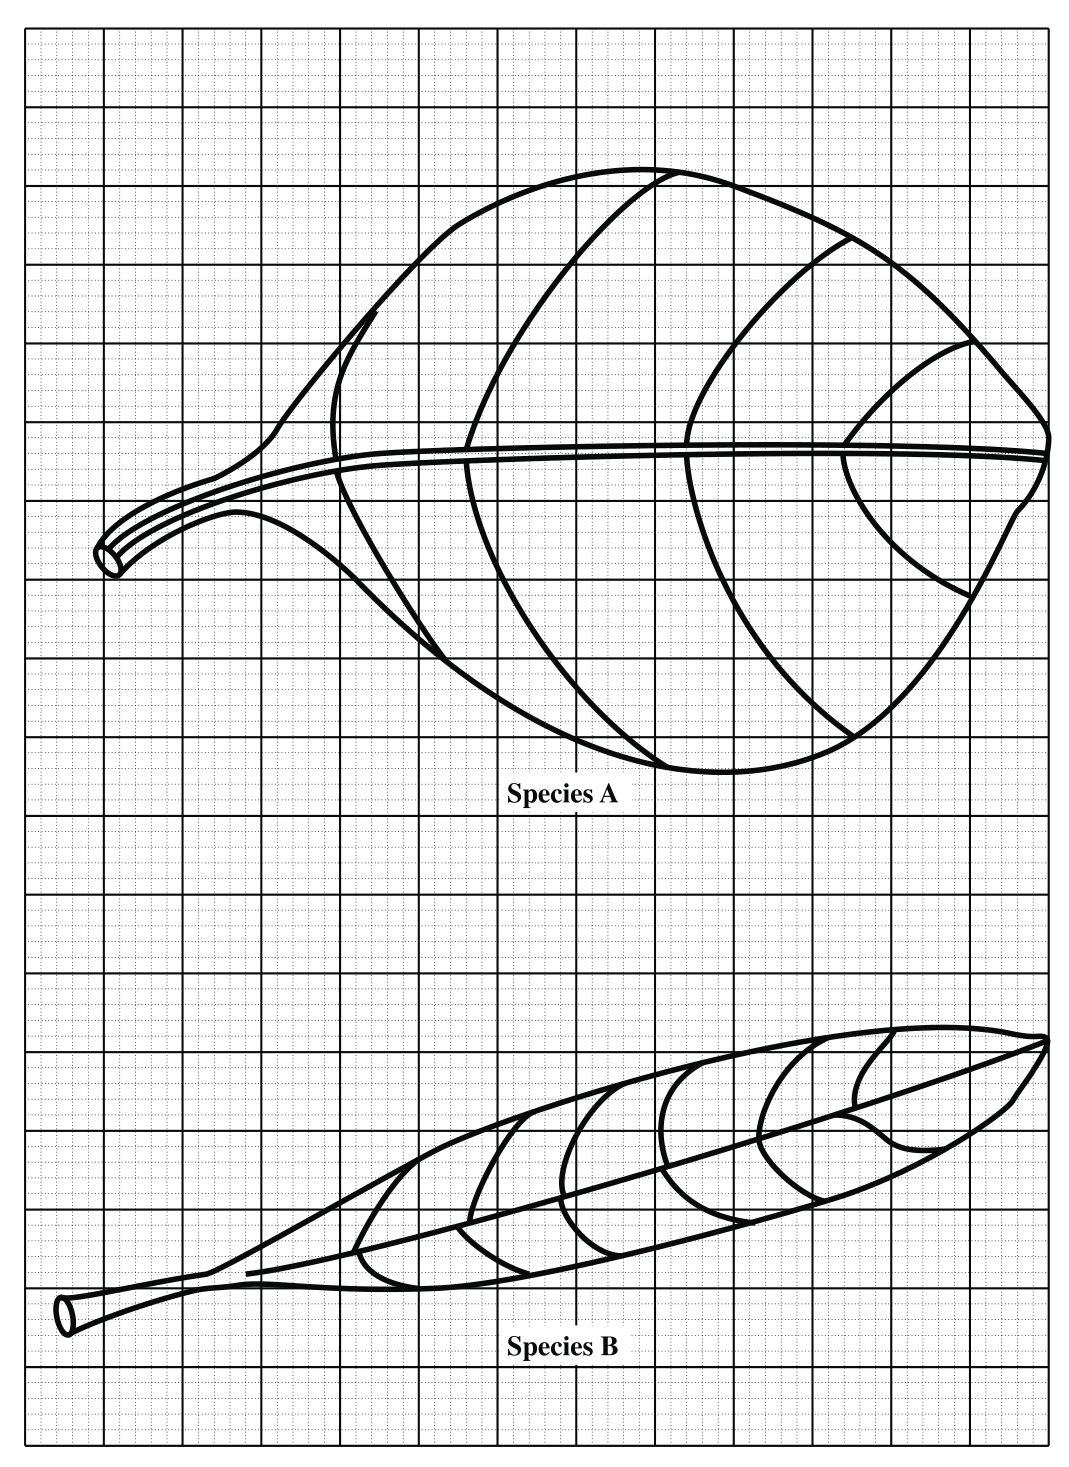
Leaves are collected from two species of plants growing in a rainforest. One species is found in the undergrowth (shaded area) while the other species is found in an open area where the tall trees have been cut down. A leaf from each area is shown in Figure 1.
[25 marks]
Calculate the surface area of EACH leaf.
Species A: Species B:
[3 marks]
Suggest which leaf is found in the open area. Give a reason for your answer.
Species: Reason:
[2 marks]
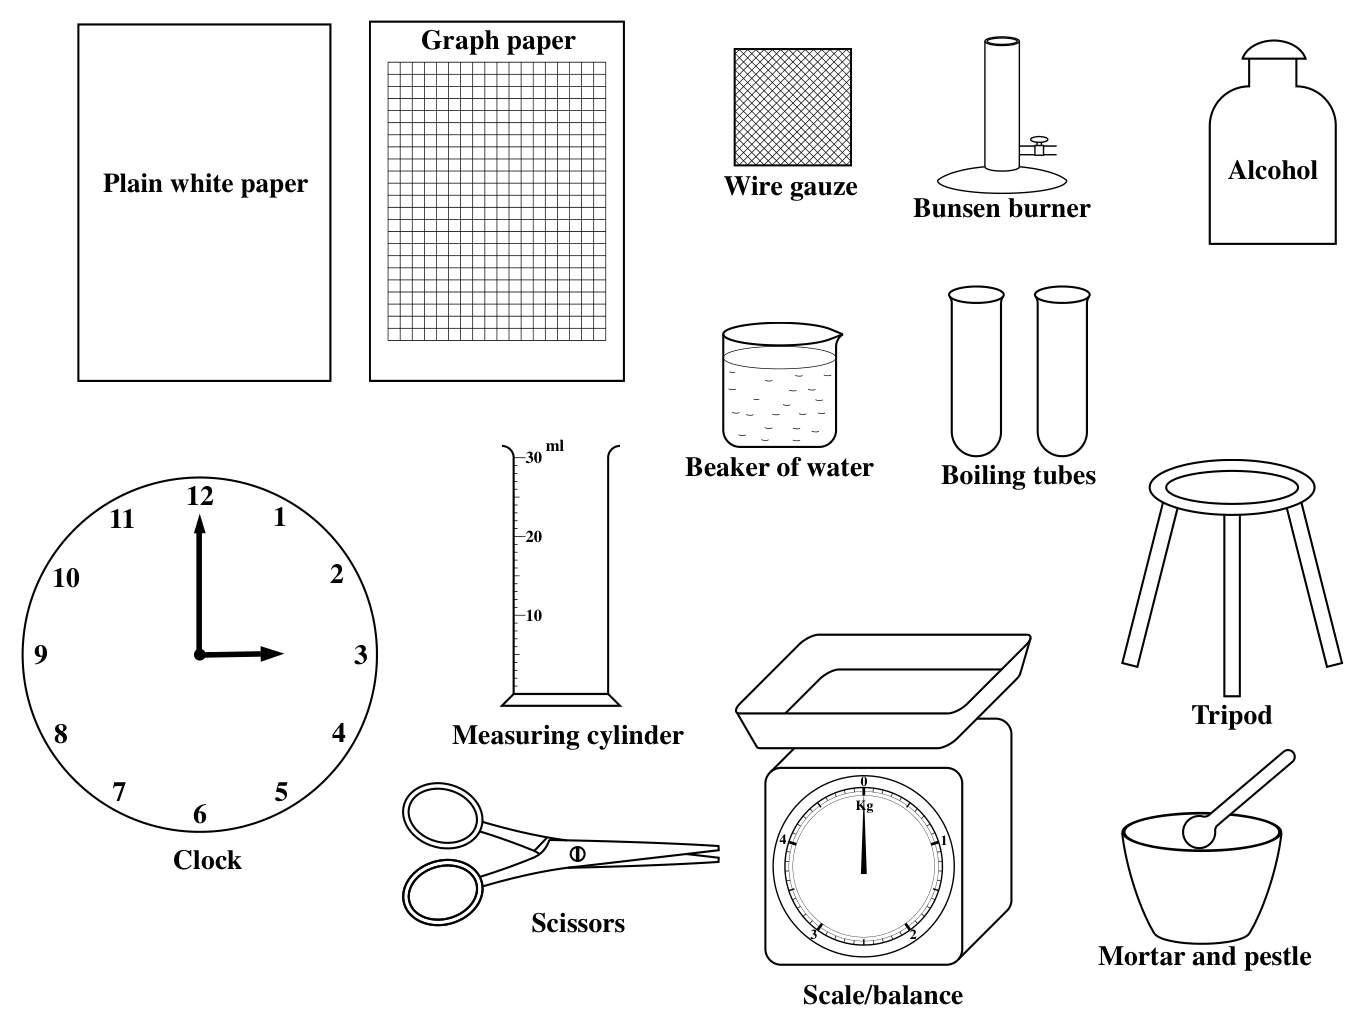
Outline how the apparatus and materials shown in Figure 2 could be used to compare the chlorophyll content of each leaf.
[6 marks]