Free CXC Biology Paper 3 May/June 2013 past paper from 2013. Includes a worked answer key. Open the PDF, take a timed test, and study with AI on Caribbean AI.
Answer keys are free on Caribbean AI. View the answers to every past-paper question at no cost - no payment needed - with step-by-step worked solutions and instant AI marking available on Premium.
CSEC Biology Paper 3 May/June 2013 - Free CXC Past Paper with Answers
Free CXC Biology Paper 3 May/June 2013 past paper from 2013. Includes a worked answer key. Open the PDF, take a timed test, and study with AI on Caribbean AI.
Opening the interactive papers…
Every question from this paper as text. See the answers and worked solutions. Questions are the property of the Caribbean Examinations Council; Caribbean AI is not affiliated with CXC.
The biologists set up a line transect to investigate the changing distribution of organisms, two miles inland from the river bank on either side of the river. Describe how this apparatus is to be used.
[3 marks]
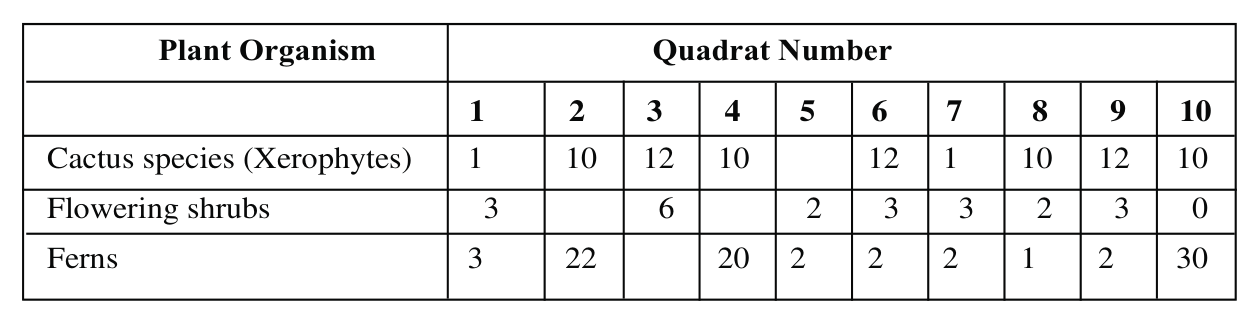
The biologists also use a quadrat to investigate the distribution of different plant species found within on either side of the river bank. Some of this data is given in Table 1.
| Plant Organism | \multicolumn{10}{|c|}{Quadrat Number} | | :------------- | :--- | :--- | :--- | :--- | :--- | :--- | :--- | :--- | :--- | :--- | | | 1 | 2 | 3 | 4 | 5 | 6 | 7 | 8 | 9 | 10 | | Cactus species (Xerophytes) | 1 | 10 | 12 | 10 | 12 | 1 | 10 | 12 | 10 | | Flowering shrubs | 3 | 6 | 2 | 3 | 3 | 2 | 3 | 0 | | Ferns | 3 | 22 | 20 | 2 | 2 | 1 | 2 | 30 |
(i) Calculate the species density of EACH of the three plant species using the data in Table 1. Show your working in each case.
Cactus species
Flowering shrubs
Ferns
[10 marks]
Suggest TWO reasons why the number of ferns counted on the third throw of the quadrat was so low, compared with the results obtained on the other throws.
[2 marks]
Predict which of the three plant species would be found FURTHEST away from the river bank and give a reason for your answer.
[2 marks]
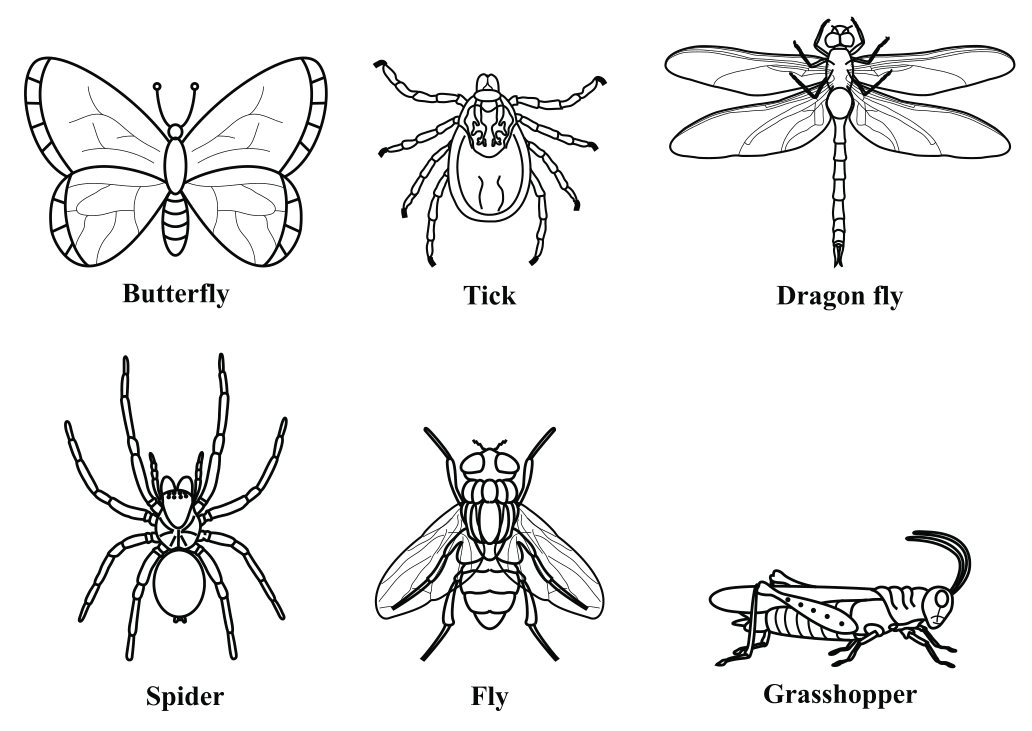
A few of the organisms found in the area are shown in Figure 1.
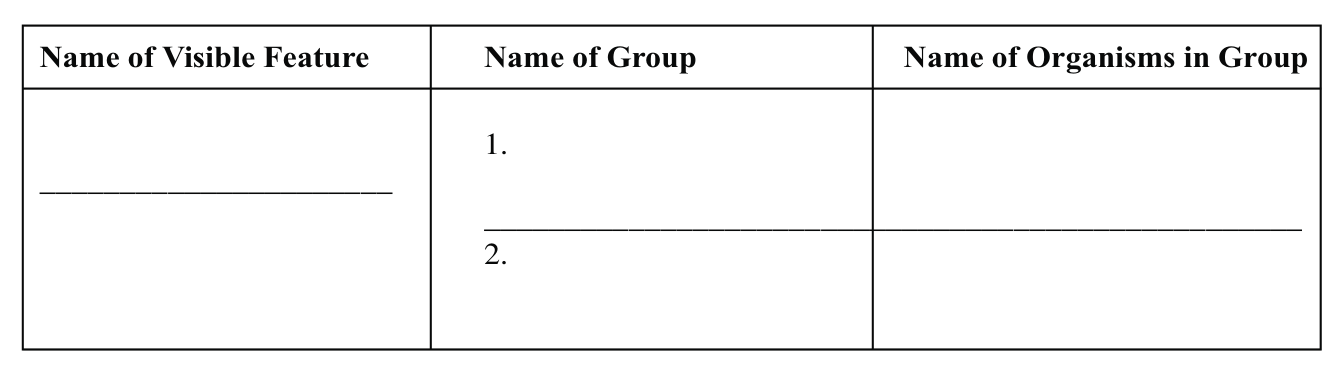
(i) Name ONE visible feature, other than wings, shown in the organisms in Figure 1, and complete Table 2 to classify the organisms into groups, using this visible feature.
| Name of Visible Feature | Name of Group | Name of Organisms in Group |
|---|---|---|
| 1. | ||
| 2. |
[5 marks]
Describe the procedure which the biologists may have used to investigate the distribution of the animals that are able to fly.
[3 marks]
State ONE precaution that should be taken when using the procedure described in (c) (ii) above.
[1 mark]
The biologists observe that the larvae of the butterflies feed on the leaves of the ferns, and small birds eat these larvae. Draw a simple pyramid in the space below to represent this information.
[3 marks]
Give ONE reason why the biologists should OR should not encourage developers to build houses in this area.
[2 marks]
Forty-eight seeds are collected from fruits taken from the same dicotyledonous plant and the seeds are weighed. The masses of the seeds range from mg to mg.
Suggest why the seeds do NOT have exactly the same weight.
[2 marks]
After a five-day period of germination, the seedlings are divided into two batches, A and of 2 seedlings each. The dry mass of three of the seedlings from each batch is deter-mined.
ist the apparatus and describe a suitable procedure for investigating the dry mass of the seedlings.
Apparatus
Procedure
[4 marks]
The remaining seedlings in atch are treated with varying amounts of organic fertili er. Suggest a suitable aim for this investigation.
[2 marks]
State which batch of seedlings would be considered the control, and give a reason for your answer.
atch
Reason
[2 marks]
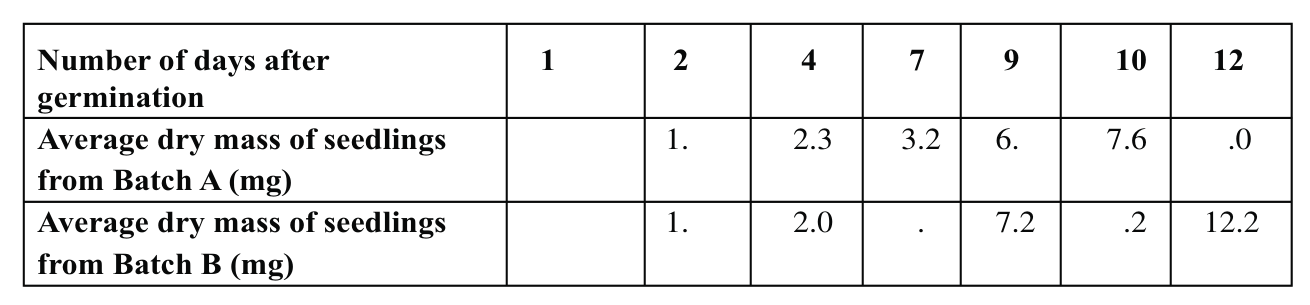
The average dry mass of three seedlings is determined over a 12-day period after germination and recorded in Table 3.
For Day 1, the dry mass of the three seedlings in atch A is $0.0.7$ and mg respectively, while the dry mass for the three seedlings in atch is $0.0.6$ and mg respectively.
Calculate the average dry mass of the three seedlings taken from EACH of the batches and record your answer in Table 3. Show your working.
Average dry mass of seedlings from atch A
Average dry mass of seedlings from atch
[4 marks]
On the grid provided in Figure 2, plot a graph of the data in Table 3.
[5 marks]
Determine the average dry mass of the seedlings on Day , from the graph in Figure 2.
atch
atch
[2 marks]
Explain the difference in the shape of the two graphs drawn in Figure 2.
[2 marks]
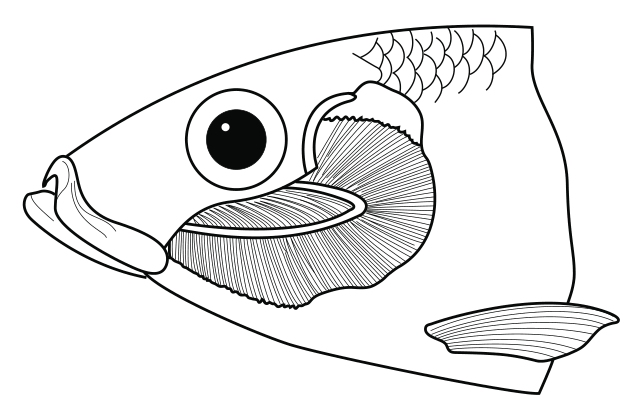
Figure 3 shows the head of a bony fish with its gills.
Make a labelled drawing of the gills in the space provided below.
[6 marks]
Calculate the magnification of your drawing. Show your working.
[2 marks]
Identify T O visible features of the gills drawn in (i) above that make them suited to their function in the bony fish.
[2 marks]