CSEC Biology Paper 3 May/June 2017 - Free CXC Past Paper with Answers
Free CXC Biology Paper 3 May/June 2017 past paper from 2017. Includes a worked answer key. Open the PDF, take a timed test, and study with AI on Caribbean AI.
Answer keys are free on Caribbean AI. View the answers to every past-paper question at no cost - no payment needed - with step-by-step worked solutions and instant AI marking available on Premium.
- All CSEC Past Papers
- CSEC Biology Past Papers
- CSEC Biology Paper 3 January 2020
- CSEC Biology Paper 3 May/June 2018
- CSEC Biology Paper 3 May/June 2014
- CSEC Biology Paper 3 May/June 2013
- CSEC Biology Paper 3 May/June 2012
- CSEC Biology Paper 3 May/June 2007
- CSEC Biology Paper 3 January 2007
- CSEC Biology Paper 3 May/June 2006
- CSEC Biology Paper 3 May/June 2005
- CSEC Biology Paper 3 January 2005
CSEC Biology Paper 3 May/June 2017 - Free CXC Past Paper with Answers
Free CXC Biology Paper 3 May/June 2017 past paper from 2017. Includes a worked answer key. Open the PDF, take a timed test, and study with AI on Caribbean AI.
Opening the interactive papers…
- All CSEC Past Papers
- CSEC Biology Past Papers
- CSEC Biology Paper 3 January 2020
- CSEC Biology Paper 3 May/June 2018
- CSEC Biology Paper 3 May/June 2014
- CSEC Biology Paper 3 May/June 2013
- CSEC Biology Paper 3 May/June 2012
- CSEC Biology Paper 3 May/June 2007
- CSEC Biology Paper 3 January 2007
- CSEC Biology Paper 3 May/June 2006
- CSEC Biology Paper 3 May/June 2005
- CSEC Biology Paper 3 January 2005
CSEC Biology Paper 3 May/June 2017 Questions
Every question from this paper as text. See the answers and worked solutions. Questions are the property of the Caribbean Examinations Council; Caribbean AI is not affiliated with CXC.
Question 1 (24 marks)
You are required to conduct an experiment using the following materials and procedure.
Materials
- 250 ml beaker containing 100 ml of water
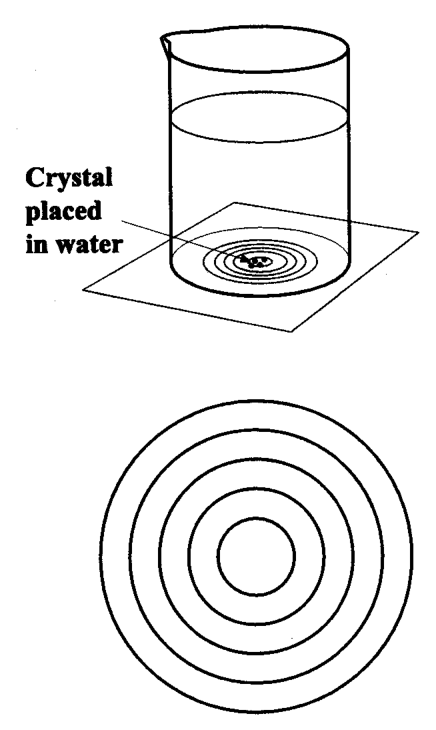
- Filter paper marked with concentric circles as shown in Figure 1
- Long forceps
- Crystals of coloured substance
- Watch glass
- Stopwatch
Procedure (i) Before starting the experiment, read through the procedure carefully, then construct a suitable table on page 3, to record the data you will collect. (ii) Pour 100 ml of water into the beaker. (iii) Place the beaker of water on the middle of the filter paper and let it stand until there is no movement of the water. See Figure 1. (iv) Using a long pair of forceps, carefully place a crystal of the coloured substance on the bottom of the beaker of water, as close to the centre of the concentric rings as possible. Note the time that the crystal is placed. (v) Record the time (in seconds) that it takes for the colour to spread to meet the edge of each concentric circle.
Present the results in the table you constructed.
[5 marks]
Suggest how the experiment could be modified to investigate the effect of temperature on the spread of the colour through the water.
[3 marks]