Free CXC Integrated Science Paper 3 May/June 2012 past paper from 2012. Includes a worked answer key. Open the PDF, take a timed test, and study with AI on Caribbean AI.
Answer keys are free on Caribbean AI. View the answers to every past-paper question at no cost - no payment needed - with step-by-step worked solutions and instant AI marking available on Premium.
CSEC Integrated Science Paper 3 May/June 2012 - Free CXC Past Paper with Answers
Free CXC Integrated Science Paper 3 May/June 2012 past paper from 2012. Includes a worked answer key. Open the PDF, take a timed test, and study with AI on Caribbean AI.
Opening the interactive papers…
Every question from this paper as text. See the answers and worked solutions. Questions are the property of the Caribbean Examinations Council; Caribbean AI is not affiliated with CXC.
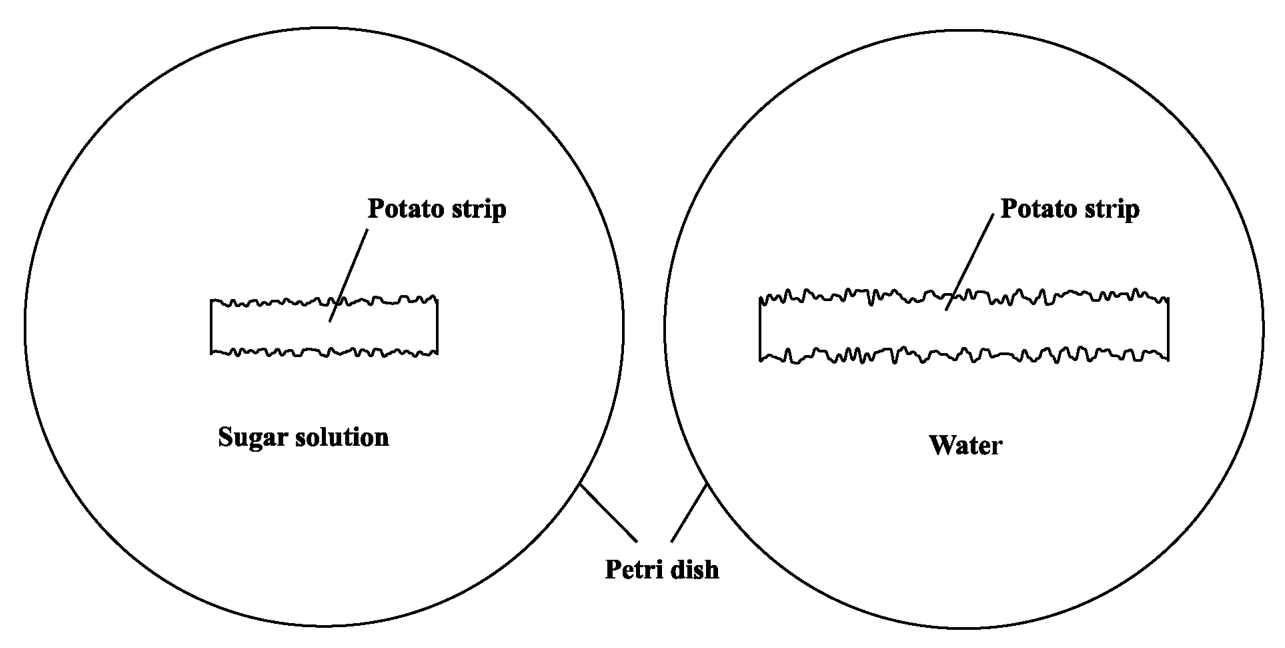
Two uncooked pieces of potato strips 4 cm long, with the same dimensions, were placed in of distilled water and of saturated sugar solution respectively for 24 hours at room temperature. The results are shown in the diagram below.
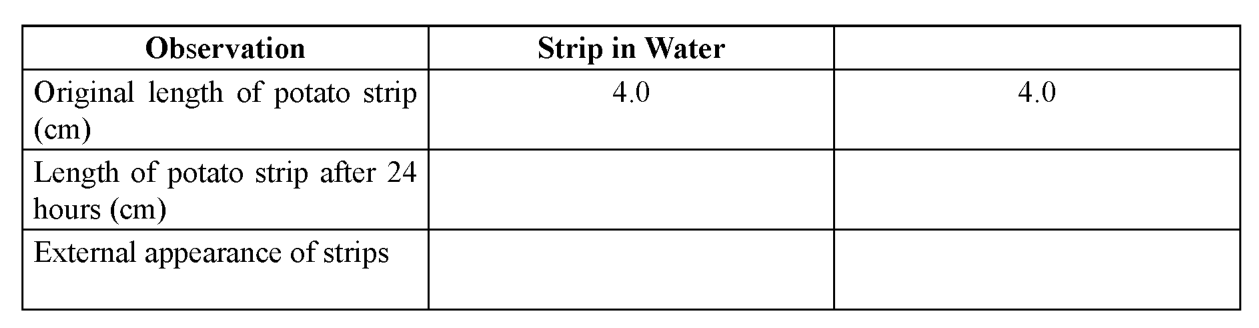
| Observation | Strip in Water | |
|---|---|---|
| Original length of potato strip (cm) | 4.0 | 4.0 |
| Length of potato strip after 24 hours (cm) | ||
| External appearance of strips |
[18 marks]
Write an appropriate heading for the last column in the table below.
[1 mark]
Write an appropriate title for the table in the space provided.
[1 mark]
Measure the length of the potato strips in Figure 1. Record your answers in the appropriate sections of Table 1.
[2 marks]
Describe the appearance of EACH strip after being in the liquid for 24 hours. Record your answer in the appropriate section of Table 1.
[2 marks]
Write an appropriate aim for this experiment.
[1 mark]
Explain the differences observed in the two strips.
[4 marks]
Explain how the results of the experiment would differ if the same experiment was repeated with strips of cooked potatoes.
[2 marks]
Explain how the results of the potato strip in water would differ if the same experiment was carried out at a lower temperature.
[1 mark]
Describe a simple experiment that can be performed to demonstrate diffusion.
[3 marks]
State ONE difference between osmosis and diffusion.
[1 mark]
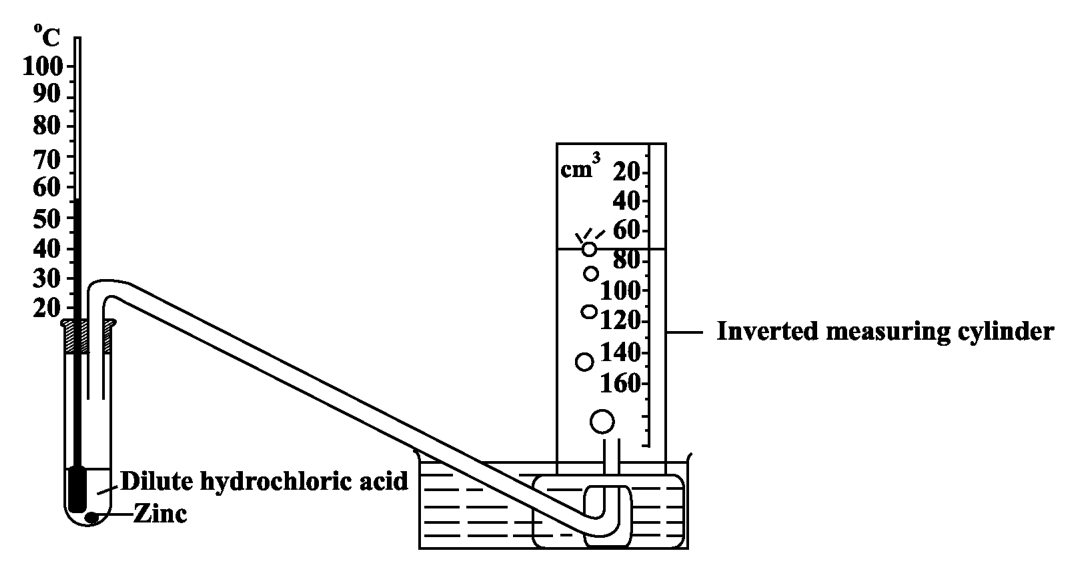
A student performed the experiment shown in Figure 2 to investigate the reaction between zinc and dilute hydrochloric acid. The initial temperature of the reactants of the test tube was noted as .
[18 marks]
A student performed the experiment shown in Figure 2 to investigate the reaction between zinc and dilute hydrochloric acid. The initial temperature of the reactants of the test tube was noted as .
Figure 2. Experiment to show reaction between zinc and dilute hydrochloric acid
[8 marks]
Name the gas given off during the reaction.
[1 mark]
Write a simple word equation for the reaction in (a) (i) above.
[2 marks]
Read the thermometer in Figure 2 and record the value in the space below.
[1 mark]
Calculate the change in temperature of the reactants.
[1 mark]
Read the inverted measuring cylinder in Figure 2, and determine the volume of gas produced by the reactants. Record your answer in the space below.
[1 mark]
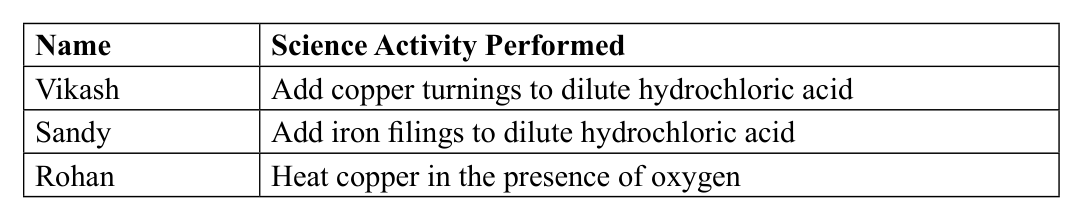
Three students were each given an activity by their science teacher as shown in Table 2.
TABLE 2: SCIENCE ACTIVITIES PERFORMED BY STUDENTS
| Name | Science Activity Performed |
|---|---|
| Vikash | Add copper turnings to dilute hydrochloric acid |
| Sandy | Add iron filings to dilute hydrochloric acid |
| Rohan | Heat copper in the presence of oxygen |
[3 marks]
In which activity will NO reaction be observed?
[1 mark]
Write a simple word equation to represent the reaction which takes place in Rohan's activity.
[2 marks]
A student constructs a hypothesis which states that a painted iron nail will rust faster than an iron nail covered with oil.
Plan and design a laboratory activity to test the hypothesis.
[9 marks]
List the materials required for the laboratory activity.
[3 marks]
Describe a suitable method to test the hypothesis.
[4 marks]
In the space below, draw a diagram of the apparatus to be used in the activity.
[2 marks]
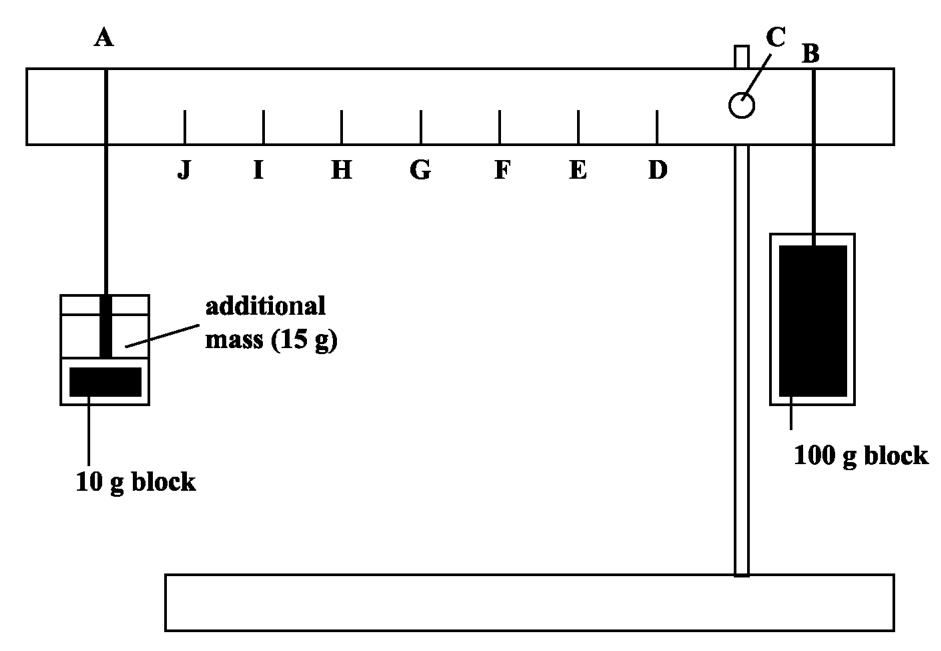
Jameel constructs a lever which has a fulcrum at C and a load of at B as shown in Figure 3. He tried to balance the lever by applying an effort at A with a block, but he found that of additional mass was required.
Figure 3. Diagram of lever
[25 marks]
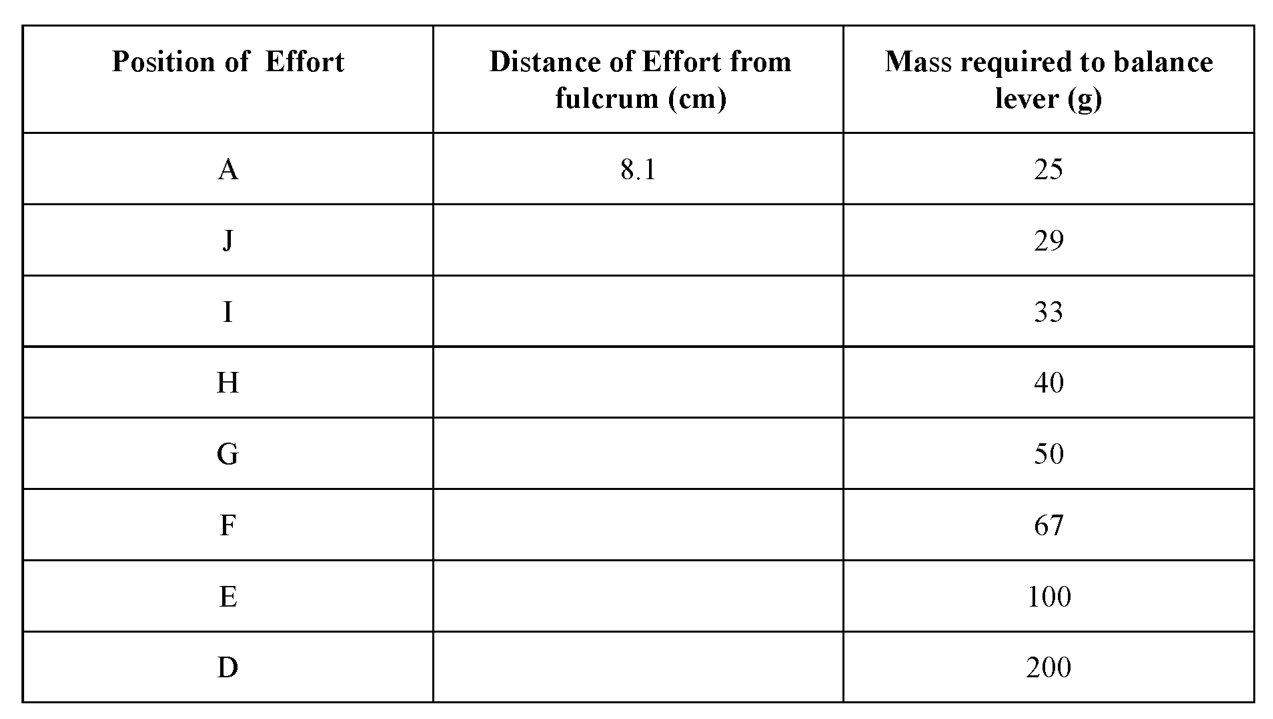
Jameel is interested in finding the values of masses which will balance the lever when they are hung at points D – J so he creates Table 3. Complete the table by using your ruler to measure the distance from the fulcrum, C, to the points D, E, F, G, H, I and J in Figure 3.
TABLE 3: MASS REQUIRED TO BALANCE LEVER AND DISTANCE OF EFFORT FROM FULCRUM
| Position of Effort | Distance of Effort from fulcrum (cm) | Mass required to balance lever (g) |
|---|---|---|
| A | 8.1 | 25 |
| J | 29 | |
| I | 33 | |
| H | 40 | |
| G | 50 | |
| F | 67 | |
| E | 100 | |
| D | 200 |
[5 marks]
Write a hypothesis relating the distance of the effort from the fulcrum and the mass required to balance the lever.
[2 marks]
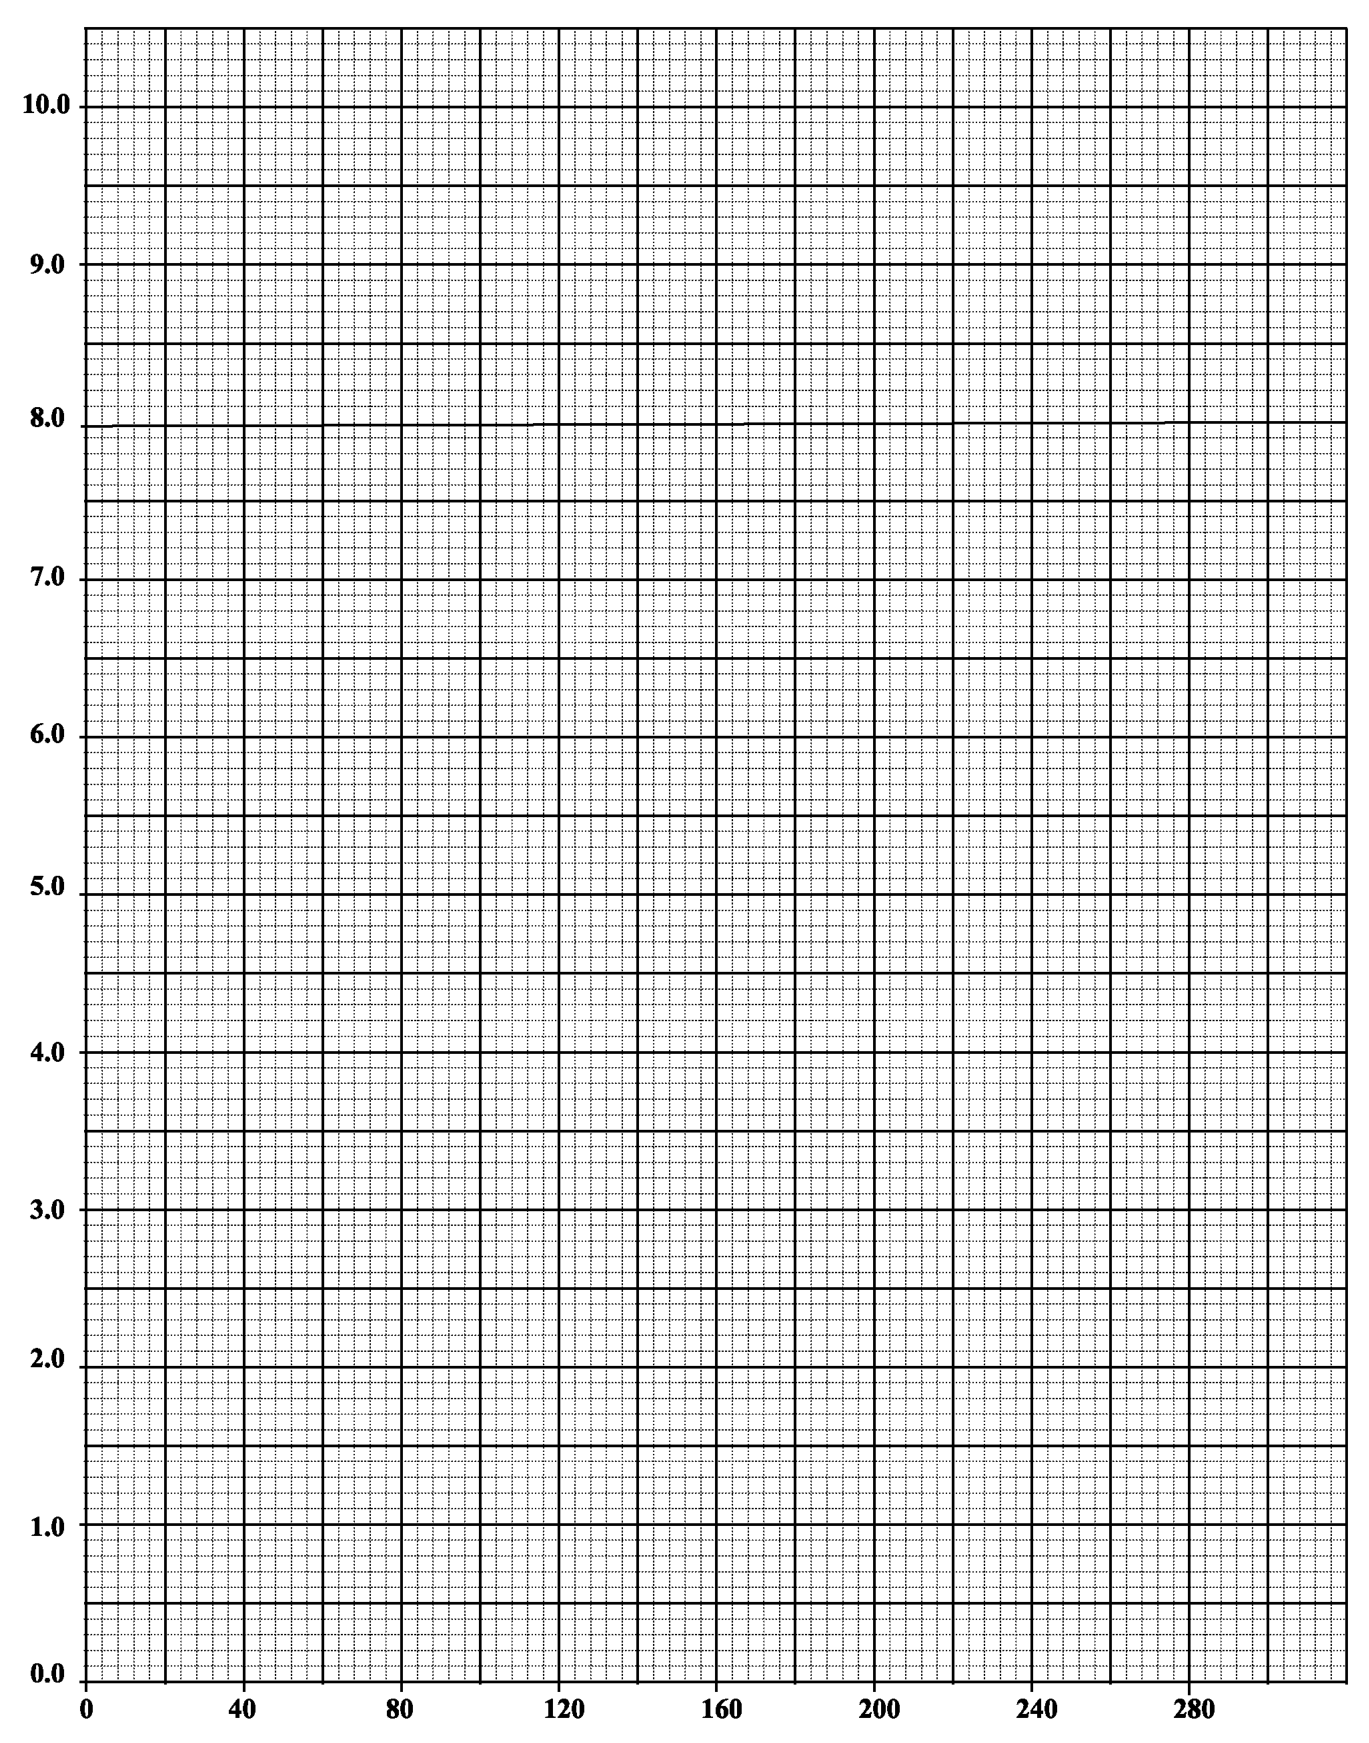
On the grid provided on page 8, plot a line graph of Jameel's results for the distance of the effort from the fulcrum against the mass required to balance the lever.
[6 marks]
On the grid provided on page 8, plot a line graph of Jameel's results for the distance of the effort from the fulcrum against the mass required to balance the lever.
[4 marks]
Label the axes on the graph.
[2 marks]
Extend your graph to read the point where the load is . Mark this point with an X.
[6 marks]
Extend your graph to read the point where the load is . Mark this point with an X.
[2 marks]
Using the graph, determine the value of the distance from the fulcrum for a load of . Draw TWO dotted lines in the appropriate places on the graph to assist you with your reading.
[4 marks]
From your graph, state how the effort changes as the distance from the fulcrum increases.
[2 marks]
Figure 4 is a picture of one of the masses used by Jameel. In the box provided, draw a two-dimensional diagram of the mass. Include the following in your drawing:
[3 marks]