CSEC Integrated Science Paper 3 May/June 2013 - Free CXC Past Paper with Answers
Free CXC Integrated Science Paper 3 May/June 2013 past paper from 2013. Includes a worked answer key. Open the PDF, take a timed test, and study with AI on Caribbean AI.
Answer keys are free on Caribbean AI. View the answers to every past-paper question at no cost - no payment needed - with step-by-step worked solutions and instant AI marking available on Premium.
- All CSEC Past Papers
- CSEC Integrated Science Past Papers
- CSEC Integrated Science Paper 3 May/June 2014
- CSEC Integrated Science Paper 3 May/June 2012
- CSEC Integrated Science Paper 3 May/June 2011
- CSEC Integrated Science Paper 3 May/June 2010
- CSEC Integrated Science Paper 3 May/June 2009
- CSEC Integrated Science Paper 3 May/June 2008
- CSEC Integrated Science Paper 3 May/June 2007
- CSEC Integrated Science Paper 3 May/June 2006
- CSEC Integrated Science Paper 3 May/June 2005
CSEC Integrated Science Paper 3 May/June 2013 - Free CXC Past Paper with Answers
Free CXC Integrated Science Paper 3 May/June 2013 past paper from 2013. Includes a worked answer key. Open the PDF, take a timed test, and study with AI on Caribbean AI.
Opening the interactive papers…
- All CSEC Past Papers
- CSEC Integrated Science Past Papers
- CSEC Integrated Science Paper 3 May/June 2014
- CSEC Integrated Science Paper 3 May/June 2012
- CSEC Integrated Science Paper 3 May/June 2011
- CSEC Integrated Science Paper 3 May/June 2010
- CSEC Integrated Science Paper 3 May/June 2009
- CSEC Integrated Science Paper 3 May/June 2008
- CSEC Integrated Science Paper 3 May/June 2007
- CSEC Integrated Science Paper 3 May/June 2006
- CSEC Integrated Science Paper 3 May/June 2005
CSEC Integrated Science Paper 3 May/June 2013 Questions
Every question from this paper as text. See the answers and worked solutions. Questions are the property of the Caribbean Examinations Council; Caribbean AI is not affiliated with CXC.
Question 1 (14 marks)
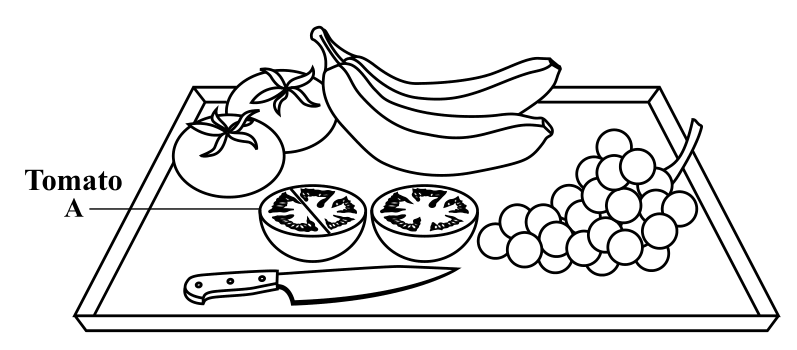
Measure the diameter of Tomato A along the line shown in the tomato.
[2 marks]
A cross-section of each fruit is placed in a petri dish. A few drops of iodine solution are placed on each fruit.
Write a suitable aim for this experiment.
[1 mark]
Construct an appropriate table to record the results of the activity in (b) (i).
[3 marks]
The following observations are made with the iodine solution:
- Banana – turned blue black
- Tomato – no colour change
- Grape – no colour change
What scientific conclusions can be made from these observations?
[3 marks]