Free CXC Mathematics Paper 2 May/June 2009 past paper from 2009. Includes a worked answer key. Open the PDF, take a timed test, and study with AI on Caribbean AI.
Answer keys are free on Caribbean AI. View the answers to every past-paper question at no cost - no payment needed - with step-by-step worked solutions and instant AI marking available on Premium.
CSEC Mathematics Paper 2 May/June 2009 - Free CXC Past Paper with Answers
Free CXC Mathematics Paper 2 May/June 2009 past paper from 2009. Includes a worked answer key. Open the PDF, take a timed test, and study with AI on Caribbean AI.
Opening the interactive papers…
Every question from this paper as text. See the answers and worked solutions. Questions are the property of the Caribbean Examinations Council; Caribbean AI is not affiliated with CXC.
SECTION I
Answer ALL the questions in this section.
All working must be clearly shown.
Using a calculator, or otherwise, calculate the EXACT value of
[12 marks]
Using a calculator, or otherwise, calculate the EXACT value of
giving your answer as a common fraction
[3 marks]
giving your answer in standard form.
[3 marks]
The basic wage earned by a truck driver for a 40-hour week is $560.00.
Calculate his hourly rate.
[1 mark]
For overtime work, the driver is paid one and a half times the basic hourly rate. Calculate his overtime wage for 10 hours of overtime.
[2 marks]
Calculate the TOTAL wages earned by the truck driver for a 55-hour week.
[3 marks]
Factorise completely:
[12 marks]
Factorise completely:
[2 marks]
[2 marks]
[2 marks]
One packet of biscuits costs and one cup of ice cream costs . One packet of biscuits and two cups of ice cream cost $8.00, while three packets of biscuits and one cup of ice cream cost $9.00.
Write a pair of simultaneous equations in and to represent the given information above.
[2 marks]
Solve the equations obtained in (b) (i) above to find the cost of one packet of biscuits and the cost of one cup of ice cream.
[4 marks]
In a survey of 50 students,
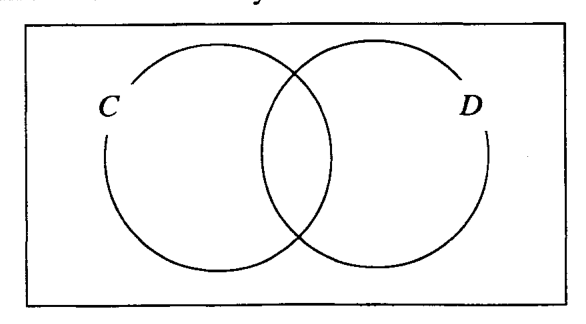
Let represent the set of students in the survey who owned cellular phones, and the set of students who owned digital cameras.
[11 marks]
In a survey of 50 students,
Let represent the set of students in the survey who owned cellular phones, and the set of students who owned digital cameras.
Copy and complete the Venn diagram below to represent the information obtained from the survey.
[2 marks]
Write an expression in for the TOTAL number of students in the survey.
[1 mark]
Calculate the value of .
[2 marks]
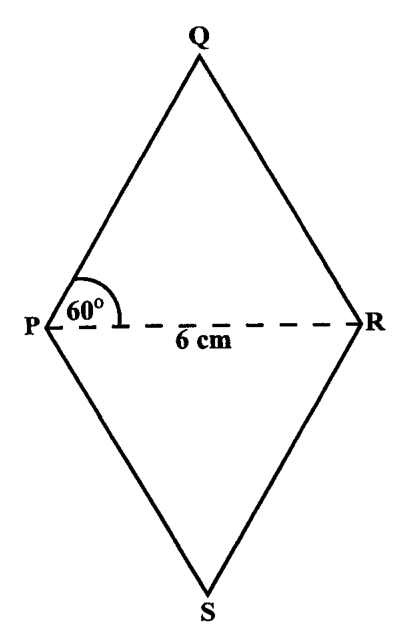
The diagram below, not drawn to scale, shows a rhombus, , with the diagonal cm, and the angle .
Using a ruler, a pencil, and a pair of compasses, construct the rhombus accurately.
[4 marks]
Join . Measure and state, in centimetres, the length of .
[2 marks]
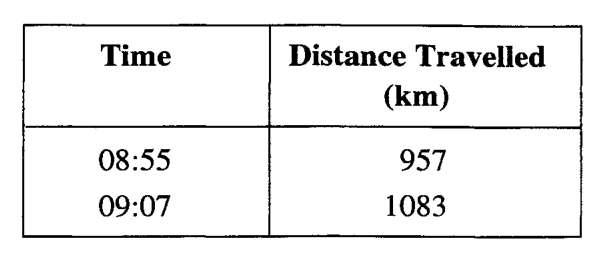
The table below shows two readings taken from an aircraft's flight record.
| Time | Distance Travelled (km) |
|---|---|
| 08:55 | 957 |
| 09:07 | 1083 |
For the period of time between the two readings, calculate
[11 marks]
The table below shows two readings taken from an aircraft's flight record.
| Time | Distance Travelled (km) |
|---|---|
| 08:55 | 957 |
| 09:07 | 1083 |
For the period of time between the two readings, calculate
the distance travelled in kilometres
[1 mark]
the average speed of the aircraft in km/h.
[3 marks]
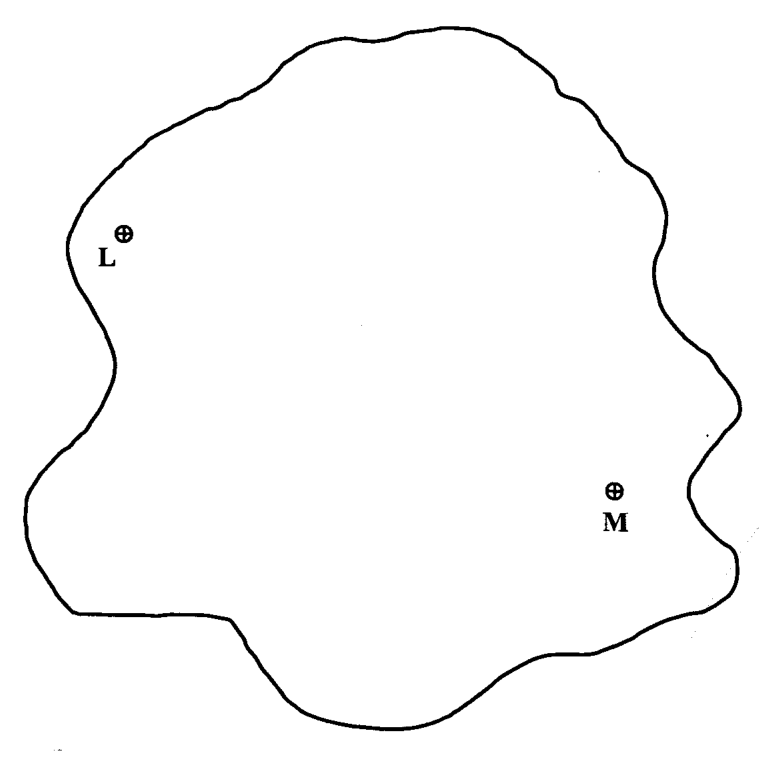
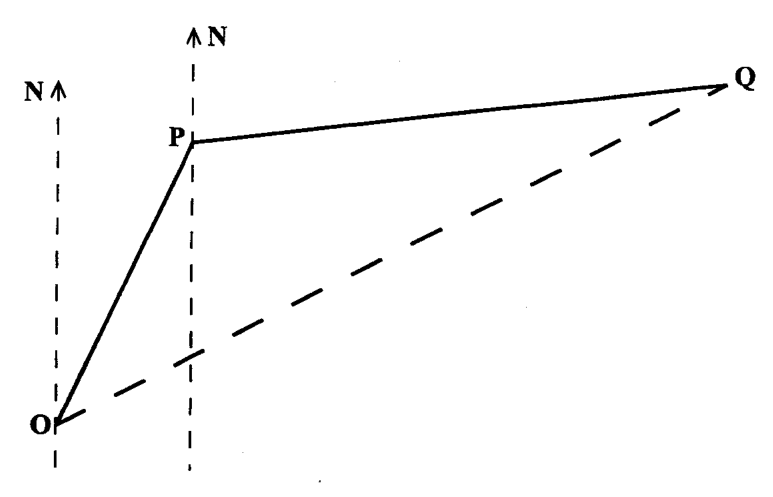
The map shown below is drawn to a scale of 1:50 000.
Measure and state, in centimetres, the distance on the map from to along a straight line.
[2 marks]
Calculate the actual distance, in kilometres, from to .
[2 marks]
The actual distance between two points is 4.5 km. Calculate the number of centimetres that should be used to represent this distance on the map.
[3 marks]
Given that and , calculate the value of
[12 marks]
Given that and , calculate the value of
[1 mark]
[2 marks]
.
[2 marks]
Given that
Copy and complete the table below.
| -4 | -3 | -2 | -1 | 0 | 1 | 2 | |
|---|---|---|---|---|---|---|---|
| 5 | -3 | -3 | -4 | -3 | 5 |
[2 marks]
Using a scale of 2 cm to represent 1 unit on the x-axis and 1 cm to represent 1 unit on the y-axis, draw the graph of for .
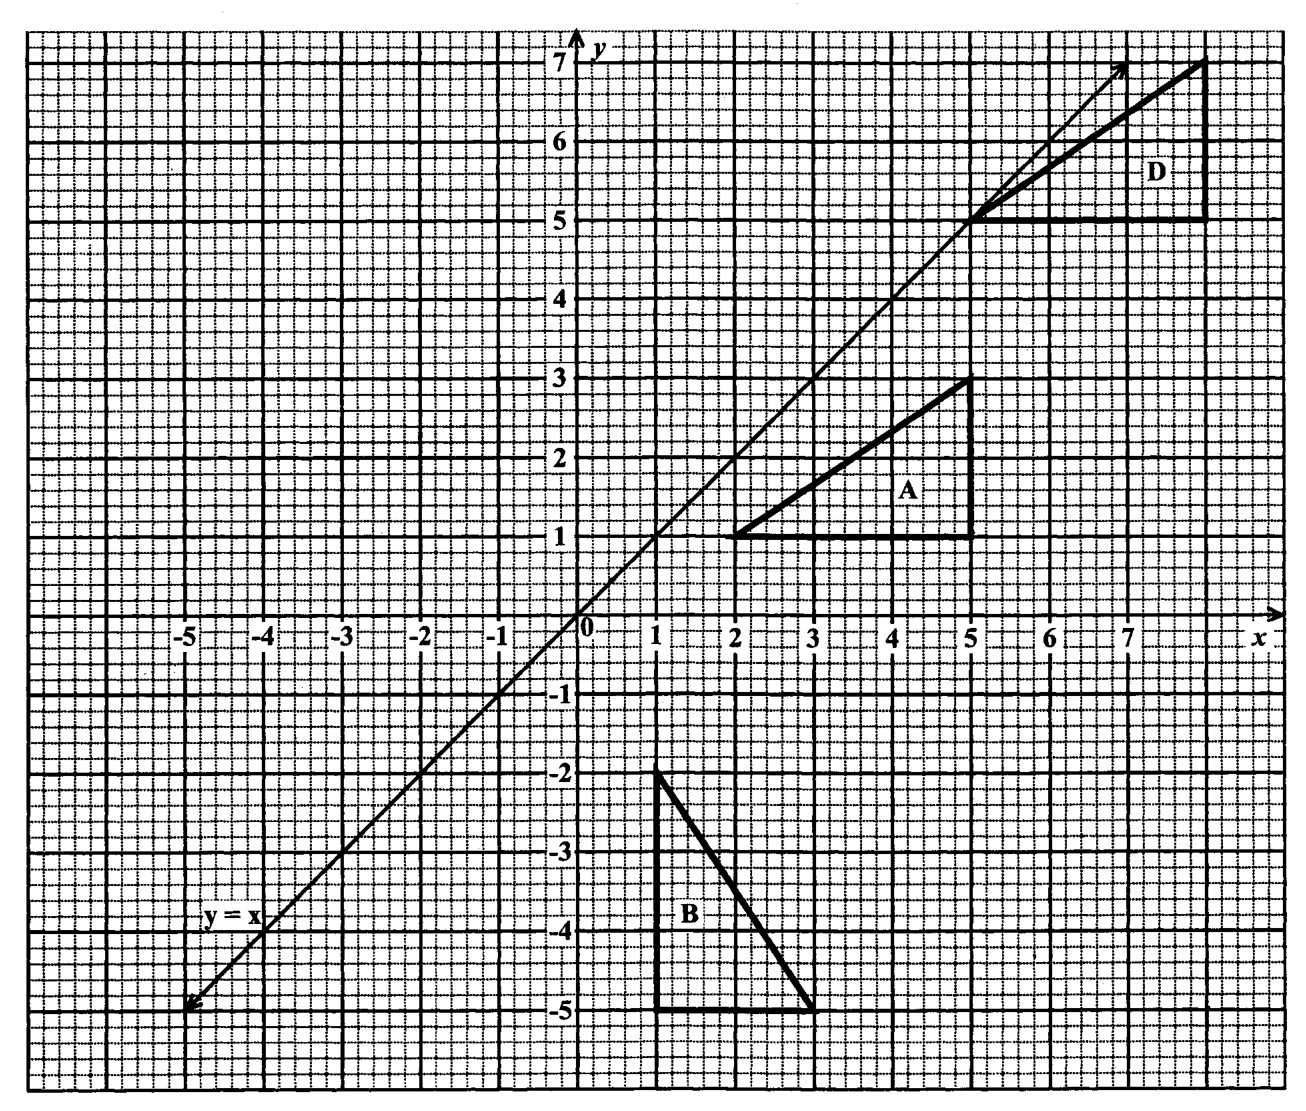
The diagram below shows triangles , and . The line is also shown.
[10 marks]
Describe, FULLY, the single transformation which maps triangle onto
[6 marks]
triangle .
[3 marks]
triangle .
[3 marks]
State the coordinates of the vertices of triangle , the image of triangle after a reflection in the line .
[4 marks]
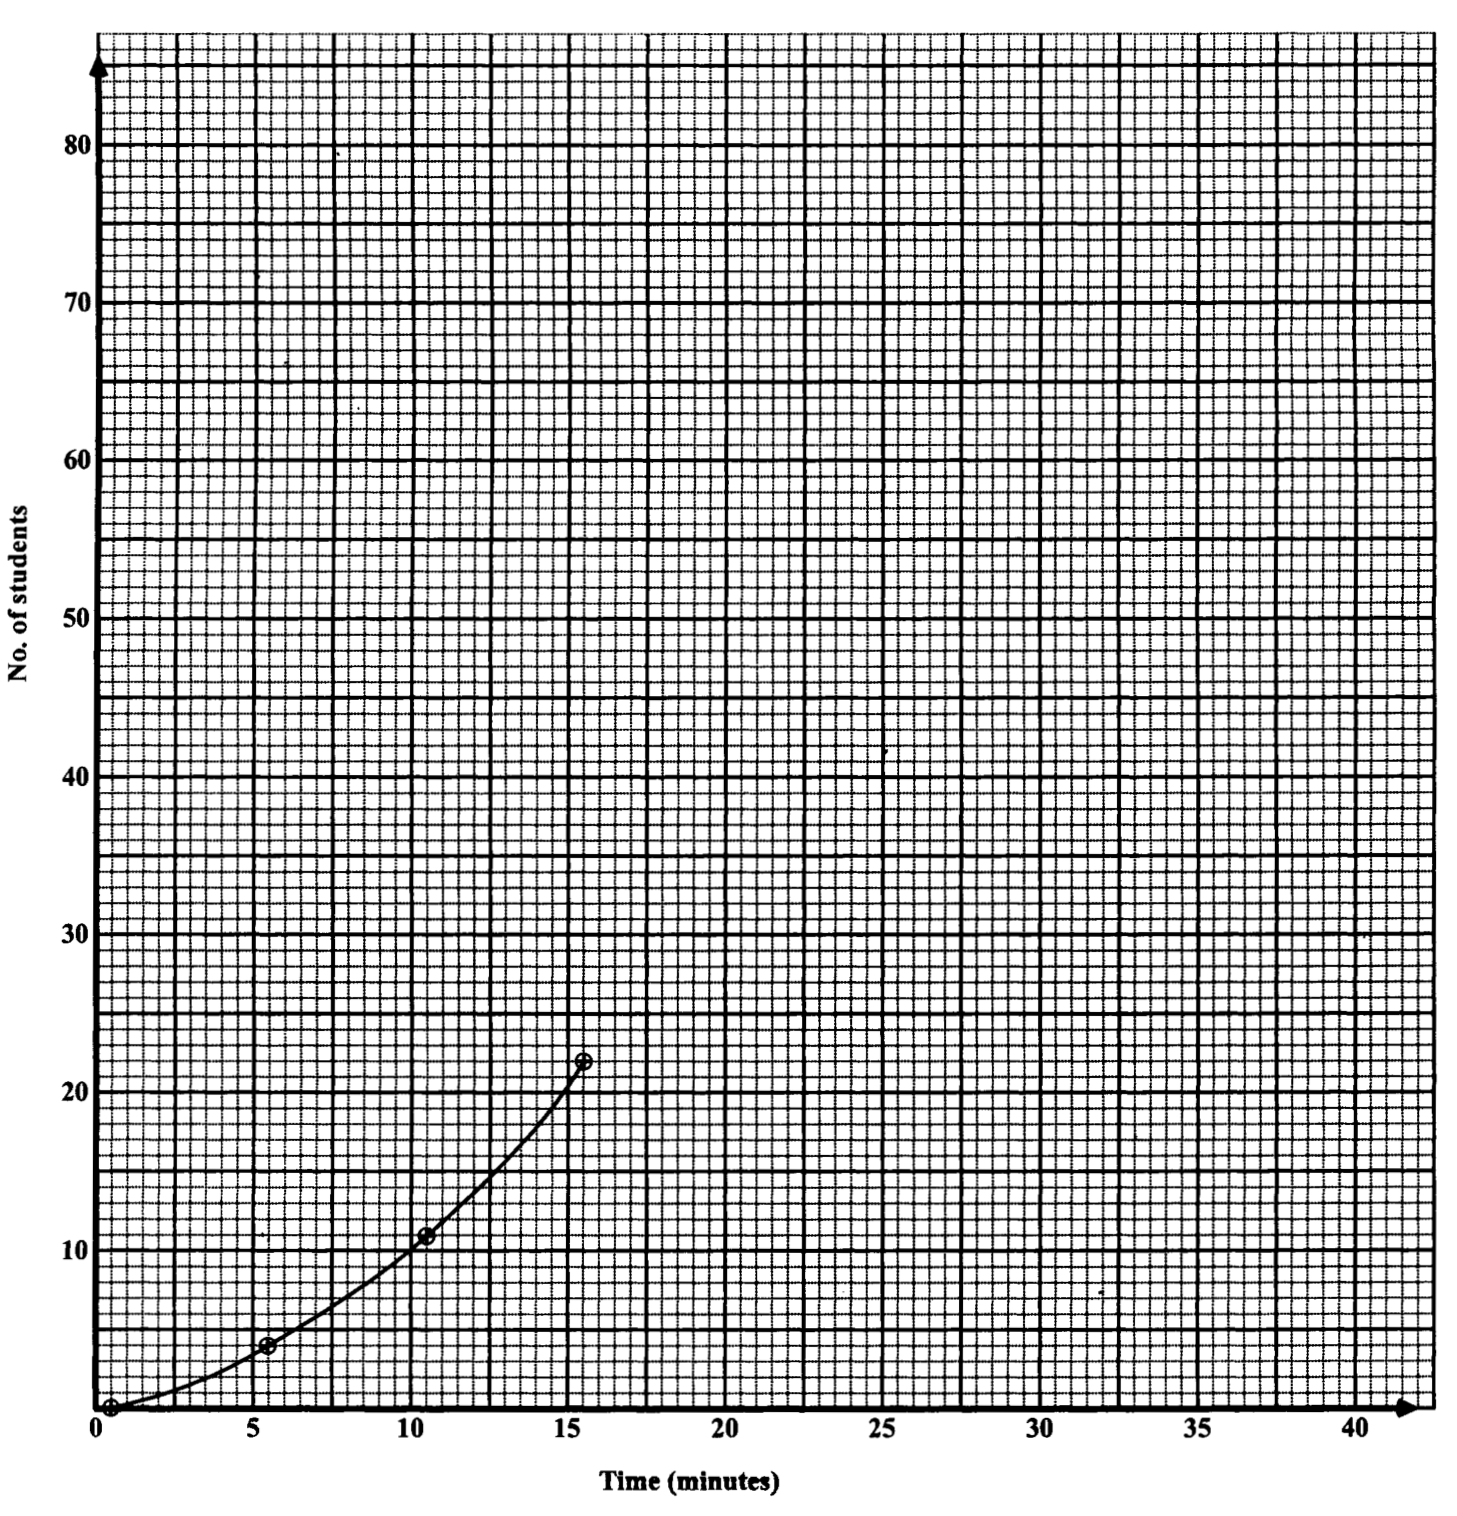
An answer sheet is provided for this question.
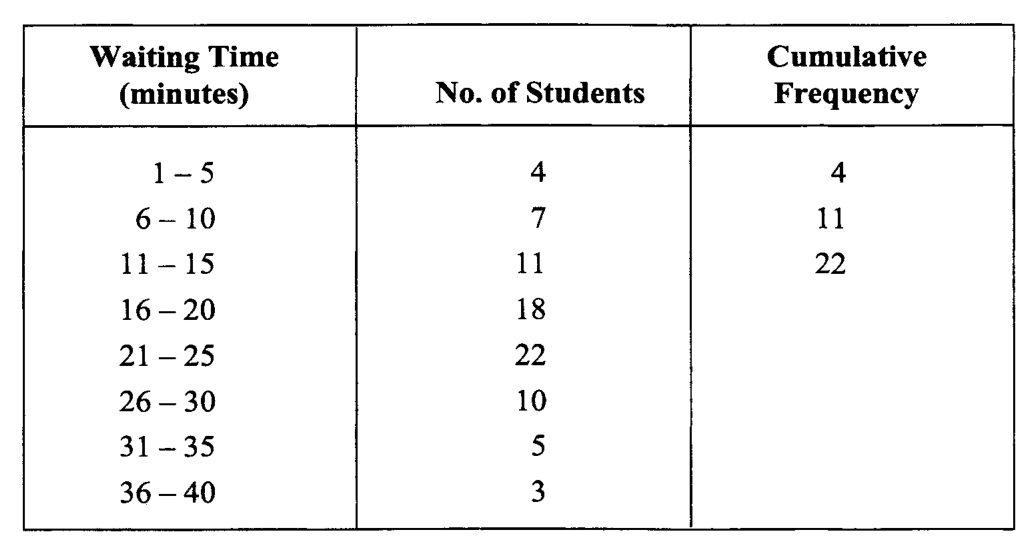
The table below shows the time, to the nearest minute, that 80 students waited to be served at a school's canteen.
| Waiting Time (minutes) | No. of Students | Cumulative Frequency |
|---|---|---|
| 1 – 5 | 4 | 4 |
| 6 – 10 | 7 | 11 |
| 11 – 15 | 11 | 22 |
| 16 – 20 | 18 | |
| 21 – 25 | 22 | |
| 26 – 30 | 10 | |
| 31 – 35 | 5 | |
| 36 – 40 | 3 |
[12 marks]
Copy and complete the table, showing the cumulative frequency.
[2 marks]
On the answer sheet provided, use the values from your table to complete the cumulative frequency curve.
[4 marks]
Use your graph from (b) above to estimate
[6 marks]
the median for the data
[2 marks]
the number of students who waited for no more than 29 minutes
[2 marks]
the probability that a student, chosen at random from the group, waited for no more than 17 minutes.
[2 marks]
An answer sheet is provided for this question.
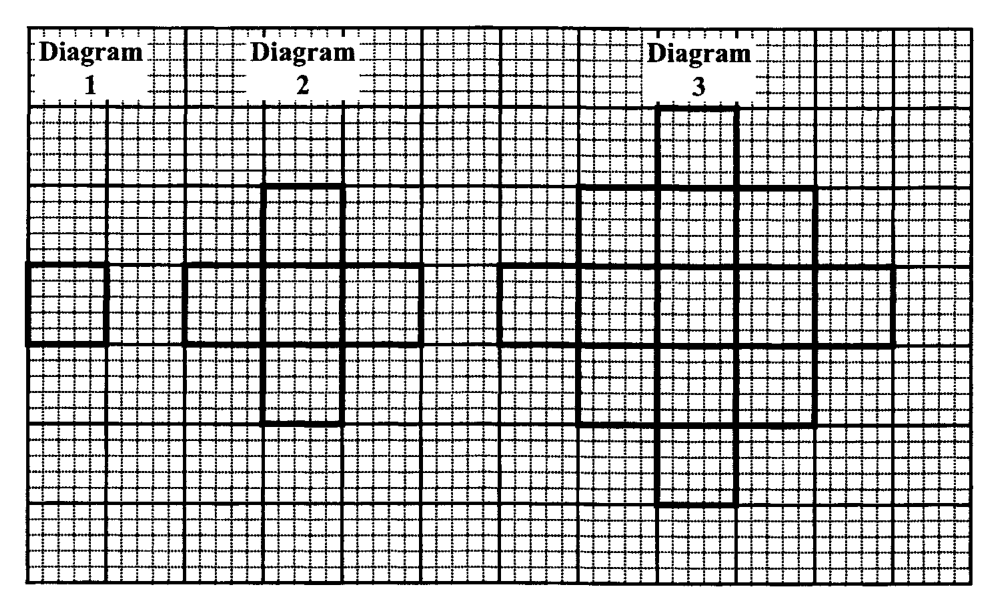
The drawings below show the first three diagrams in a sequence. Each diagram in the sequence is obtained by drawing a 1-unit square on each side that forms the perimeter of the previous diagram.
For example, Diagram 2 is obtained by drawing a 1-unit square on each of the four sides of Diagram 1.
On the answer sheet provided:
[10 marks]
Draw Diagram 4 in the sequence.
[2 marks]
Complete the table by inserting the appropriate values at the rows marked (i), (ii) and (iii).
[8 marks]
SECTION II Answer TWO questions in this section.
RELATIONS, FUNCTIONS AND GRAPHS
[15 marks]
Solve the pair of simultaneous equations .
[4 marks]
Express in the form , where , and are real numbers.
Using your answer from (b) above, or otherwise, calculate
the minimum value of
[1 mark]
the value of for which the minimum occurs.
[1 mark]
Sketch the graph of , clearly showing
Sketch on your graph of , the line which intersects the curve at the values of and calculated in (a) above.
The owner of a shop wishes to buy guitars and violins.
[15 marks]
The owner of a shop wishes to buy guitars and violins. To satisfy the demands of his customers, the number of violins must be less than or equal to the number of guitars.
Write an inequality to represent this information.
[1 mark]
The cost of one guitar is $150 and the cost of one violin is $300. He has $4 500 to spend on the purchase of these instruments.
Write an inequality to represent this information.
[2 marks]
To get a good bargain, the owner of the shop must buy at least 5 violins.
Write an inequality to represent this information.
[1 mark]
Using a scale of 2 cm on the horizontal axis to represent 5 guitars, and 2 cm on the vertical axis to represent 5 violins, draw the graphs of the lines associated with the THREE inequalities written in (a) (i), (ii) and (iii) above.
[4 marks]
Shade the region on your graph that satisfies all THREE inequalities.
[1 mark]
State the coordinates of the vertices of the shaded region.
[2 marks]
The owner of the shop sells the instruments to make a profit of $60 on each guitar and $100 on each violin.
Express the TOTAL profit in terms of and .
[1 mark]
Calculate the maximum profit.
[3 marks]
GEOMETRY AND TRIGONOMETRY
[15 marks]
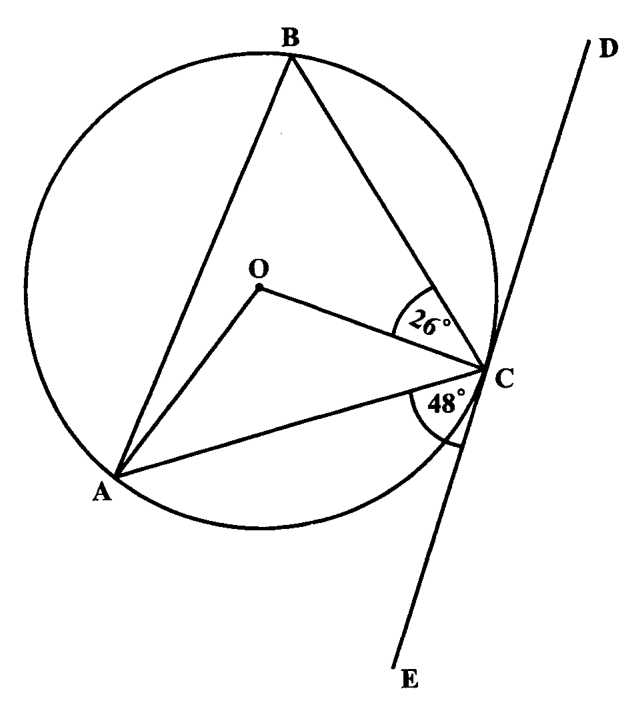
The diagram below, not drawn to scale, shows a circle, centre . The line is a tangent to the circle. Angle and angle .
Calculate:
[1 mark]
[1 mark]
[1 mark]
[1 mark]
[1 mark]
[1 mark]
The diagram below, not drawn to scale, shows the positions of two hurricane tracking stations, and , relative to a point . is on a bearing of from , and km. is on a bearing of from and km.
Copy the diagram above. On your diagram label the angles that show the bearings of and .
[2 marks]
the length, to the nearest kilometre, of
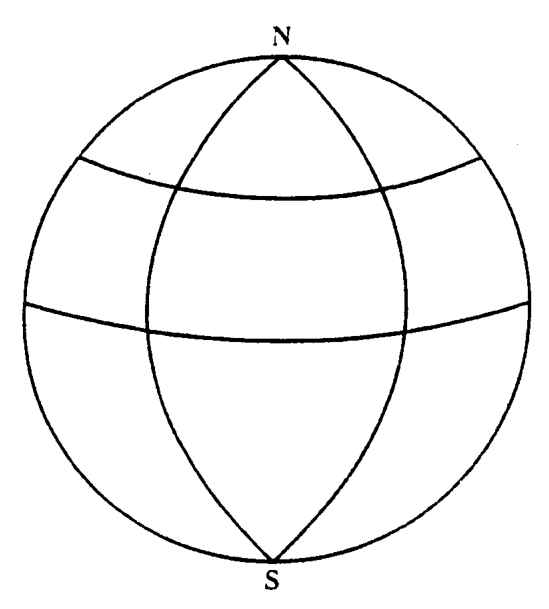
In this question, use and assume that the earth is a sphere of radius 6370 km. The diagram below, not drawn to scale, shows a sketch of the earth with the North and South Poles labelled and respectively.
Arcs representing circles of longitude and , and circles of latitude and are drawn but not labelled.
[15 marks]
Copy the sketch and
label the arc which represents: a) b)
[2 marks]
insert the points: a) b)
Calculate, to the nearest kilometre, the SHORTEST distance from
to the North Pole measured along the common circle of longitude
[3 marks]
to measured along the common circle of latitude.
[4 marks]
A point is located 2002 km due south of along the common circle of longitude. Calculate the latitude of .
[4 marks]
VECTORS AND MATRICES
[15 marks]
The points and have position vectors and where is the origin . The point lies on the line such that .
Express in the form
the vectors and
the position vector .
[2 marks]
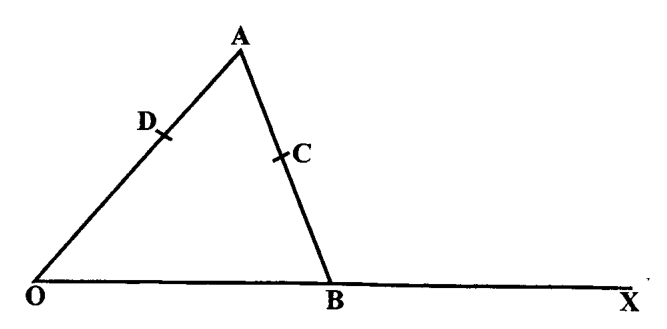
In the diagram below, not drawn to scale, is the midpoint of . is the midpoint of , and is such that . The vectors and are such that and .
Write in terms of and : a) b) c) d)
State TWO geometrical relationships between and .
[2 marks]
State ONE geometrical relationship between the points , , and .
[1 mark]
The value of the determinant of is 13.
Calculate the values of .
[4 marks]
The transformation is represented by the matrix .
Write a single matrix, in the form to represent the combined transformation followed by .
Calculate the image of the point under the combined transformation in (b) (i) above.
[3 marks]
The matrix .
Determine the inverse matrix of .
[2 marks]
Hence, calculate the value of and the value of for which .
[5 marks]
[3 marks]
[4 marks]
[2 marks]
[2 marks]
[4 marks]
[6 marks]
The transformation is represented by the matrix .
[2 marks]
[4 marks]