(b)(iv) 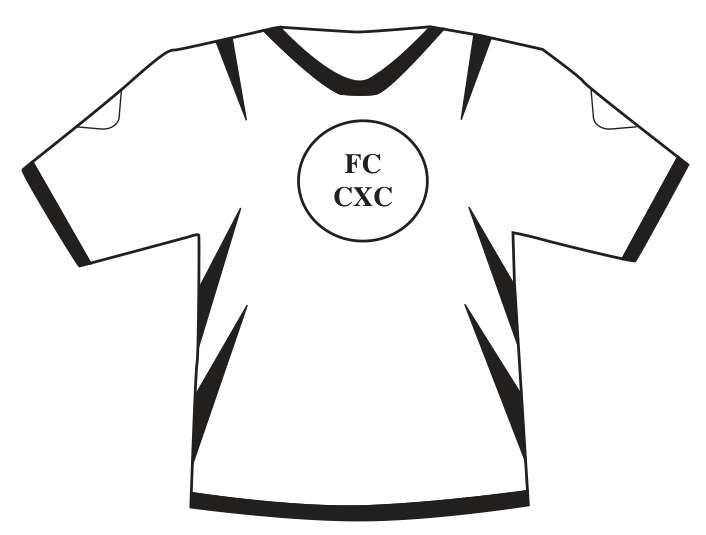
the profit made as a percentage of the cost price, giving your answer correct to the nearest whole number.
[2 marks]
Free CXC Mathematics Paper 2 May/June 2010 past paper from 2010. Includes a worked answer key. Open the PDF, take a timed test, and study with AI on Caribbean AI.
Answer keys are free on Caribbean AI. View the answers to every past-paper question at no cost - no payment needed - with step-by-step worked solutions and instant AI marking available on Premium.
CSEC Mathematics Paper 2 May/June 2010 - Free CXC Past Paper with Answers
Free CXC Mathematics Paper 2 May/June 2010 past paper from 2010. Includes a worked answer key. Open the PDF, take a timed test, and study with AI on Caribbean AI.
Opening the interactive papers…
Every question from this paper as text. See the answers and worked solutions. Questions are the property of the Caribbean Examinations Council; Caribbean AI is not affiliated with CXC.
Determine the EXACT value of: (i) (ii) giving your answer correct to 2 significant figures
[6 marks]
[3 marks]
giving your answer correct to 2 significant figures
[3 marks]
Mrs. Jack bought 150 T-shirts for $1 920 from a factory.
The T-shirts are sold at $19.99 each.
Calculate (i) the cost of ONE T-shirt. (ii) the amount of money Mrs. Jack received after selling ALL of the T-shirts (iii) the TOTAL profit made (iv) the profit made as a percentage of the cost price, giving your answer correct to the nearest whole number.
[11 marks]
the cost of ONE T-shirt.
[1 mark]
the amount of money Mrs. Jack received after selling ALL of the T-shirts
[1 mark]
the TOTAL profit made
[1 mark]
the profit made as a percentage of the cost price, giving your answer correct to the nearest whole number.
[2 marks]
Given that , and , find the value of: (i) (ii)
[2 marks]
[1 mark]
[1 mark]
Write the following phrases as algebraic expressions: (i) seven times the sum of and (ii) the product of TWO consecutive numbers when the smaller number is
[2 marks]
seven times the sum of and
[1 mark]
the product of TWO consecutive numbers when the smaller number is
[1 mark]
Solve the pair of simultaneous equations:
[3 marks]
Factorise completely: (i) (ii) (iii)
[1 mark]
[2 marks]
[2 marks]
A survey was conducted among 40 tourists. The results were:
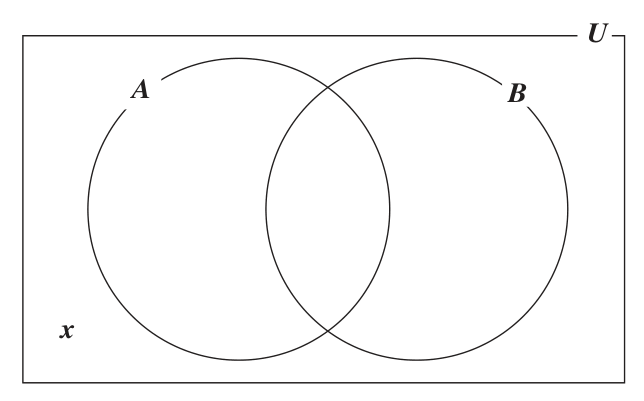
(i) Copy and complete the Venn Diagram below to represent the given information above. (ii) Write an expression, in , to represent the TOTAL number of tourists in the survey. (iii) Calculate the value of .
[6 marks]
Copy and complete the Venn Diagram below to represent the given information above.
[2 marks]
Write an expression, in , to represent the TOTAL number of tourists in the survey.
[2 marks]
Calculate the value of .
[2 marks]
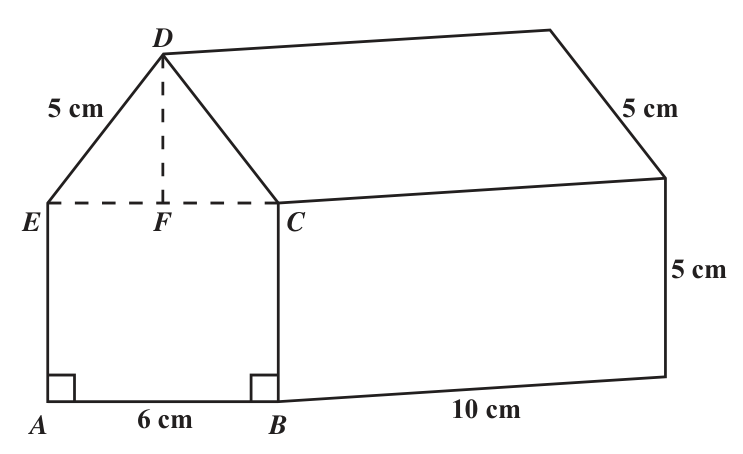
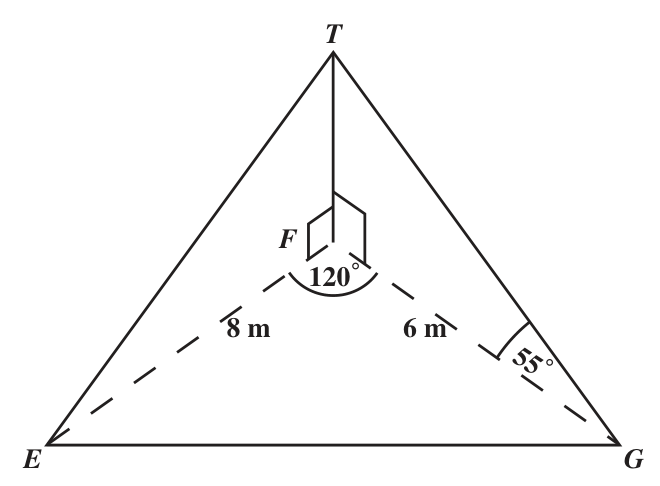
The diagram below, not drawn to scale, shows a wooden toy in the shape of a prism, with cross section . is the midpoint of , and .
the length of
[1 mark]
the length of
[2 marks]
the area of the face .
[3 marks]
When varies directly as the square of , the variation equation is written , where is a constant. (i) Given that when , find the value of . (ii) Calculate the value of when .
[4 marks]
Given that when , find the value of .
[2 marks]
Calculate the value of when .
[2 marks]
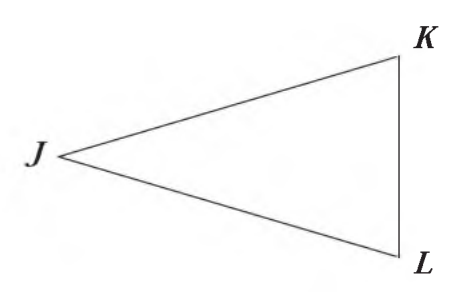
Using a ruler, a pencil and a pair of compasses, construct triangle with cm, and .
Measure and state a) the length of b) the size of .
[2 marks]
The functions and are defined as and . (i) Calculate the value of a) b) . (ii) Find .
[3 marks]
Calculate the value of a) b) .
[2 marks]
Find .
[1 mark]
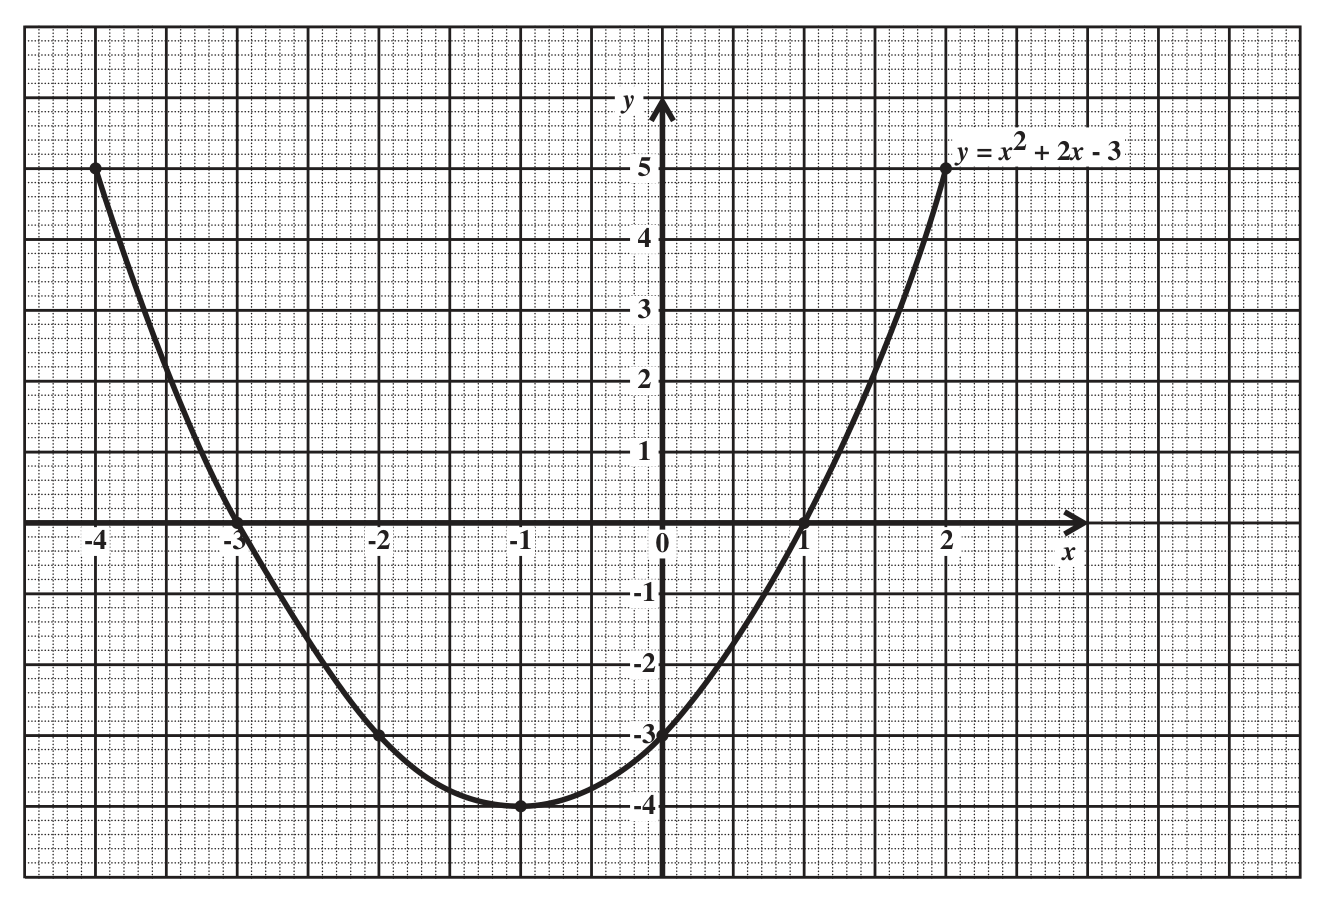
The diagram below shows the graph of for the domain .
the scale used on the x-axis
[1 mark]
the value of for which
[2 marks]
the values of for which
[2 marks]
the range of values of , giving your answer in the form , where and are real numbers.
[2 marks]
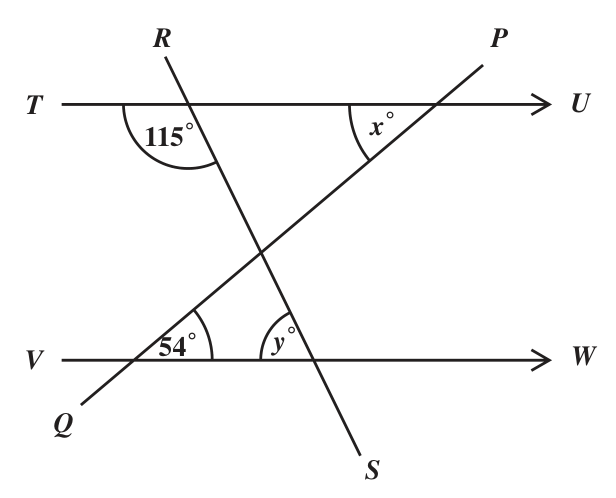
The diagram below, not drawn to scale, shows two straight lines, and , intersecting a pair of parallel lines, and .
Determine, giving a reason for EACH of your answers, the value of
.
[2 marks]
.
[2 marks]
The diagram below shows triangle , and its image, triangle , after undergoing a rotation.
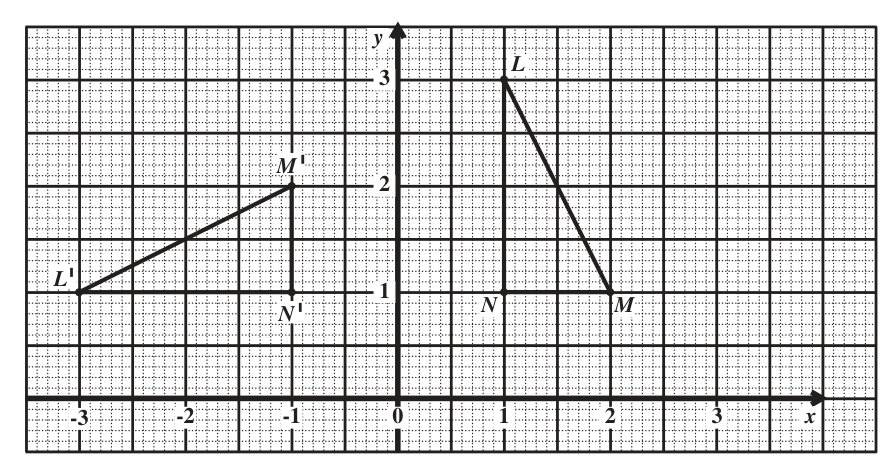
Describe the rotation FULLY by stating a) the centre b) the angle c) the direction.
[3 marks]
State TWO geometric relationships between triangle and its image, triangle .
[2 marks]
Triangle is translated by the vector . Determine the coordinates of the image of the point under this transformation.
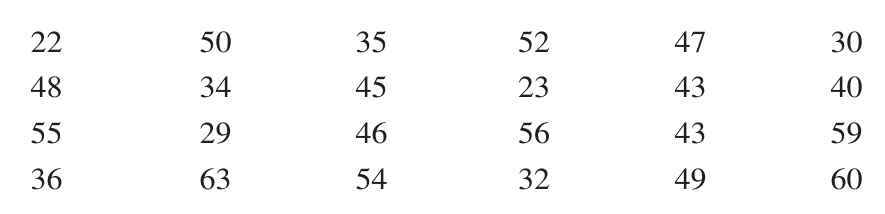
A class of 24 students threw the cricket ball at sports. The distance thrown by each student was measured to the nearest metre. The results are shown below. 22 50 35 52 47 30 48 34 45 23 43 40 55 29 46 56 43 59 36 63 54 32 49 60
Copy and complete the frequency table for the data shown above.
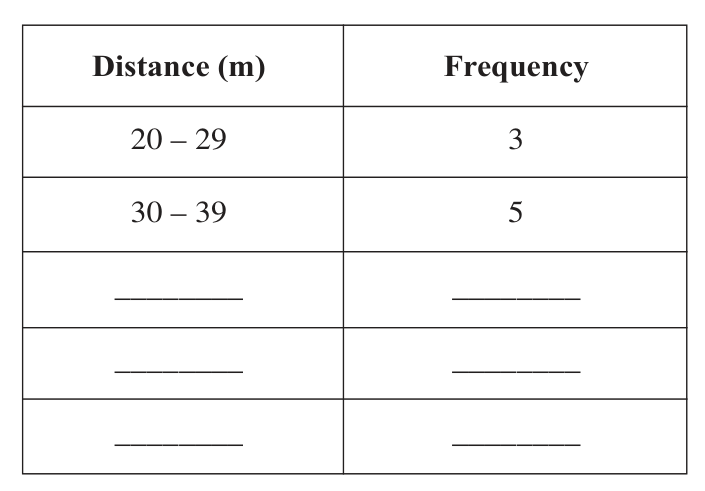
State the lower boundary for the class interval .
[1 mark]
Using a scale of 1 cm on the -axis to represent 5 students, and a scale of 1 cm on the -axis to represent 1 student, draw a histogram to illustrate the data.
[5 marks]
Determine
the number of students who threw the ball a distance recorded as 50 metres or more
[1 mark]
the probability that a student, chosen at random, threw the ball a distance recorded as 50 metres or more.
[1 mark]
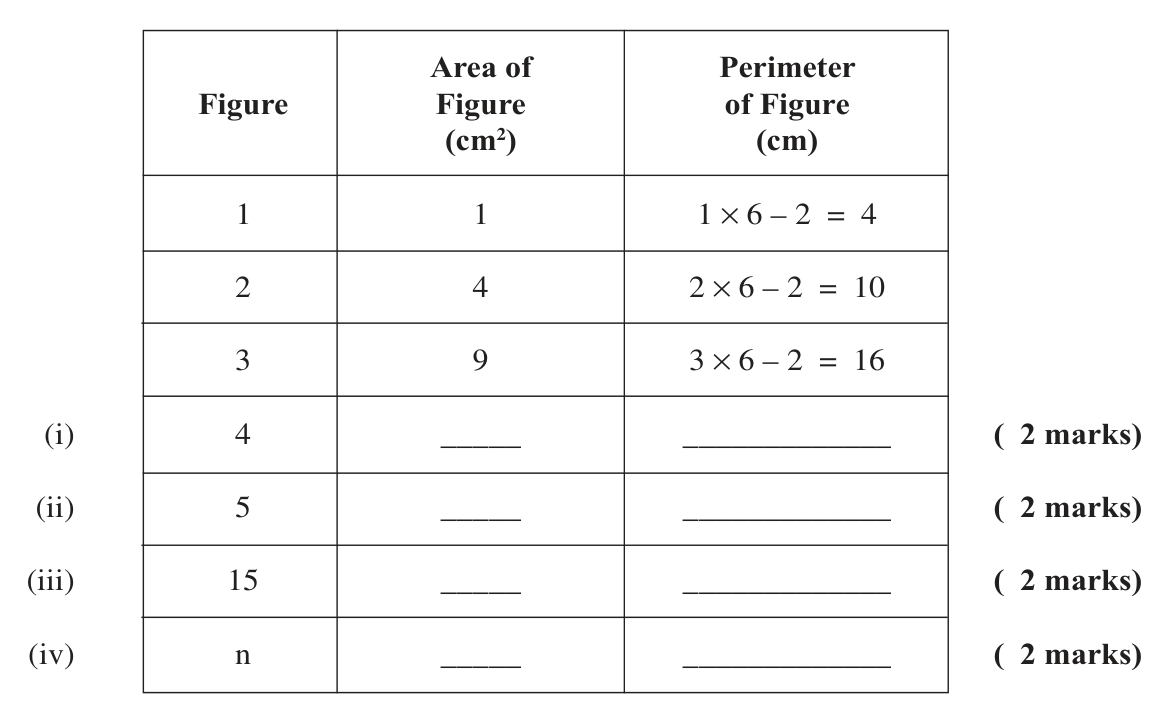
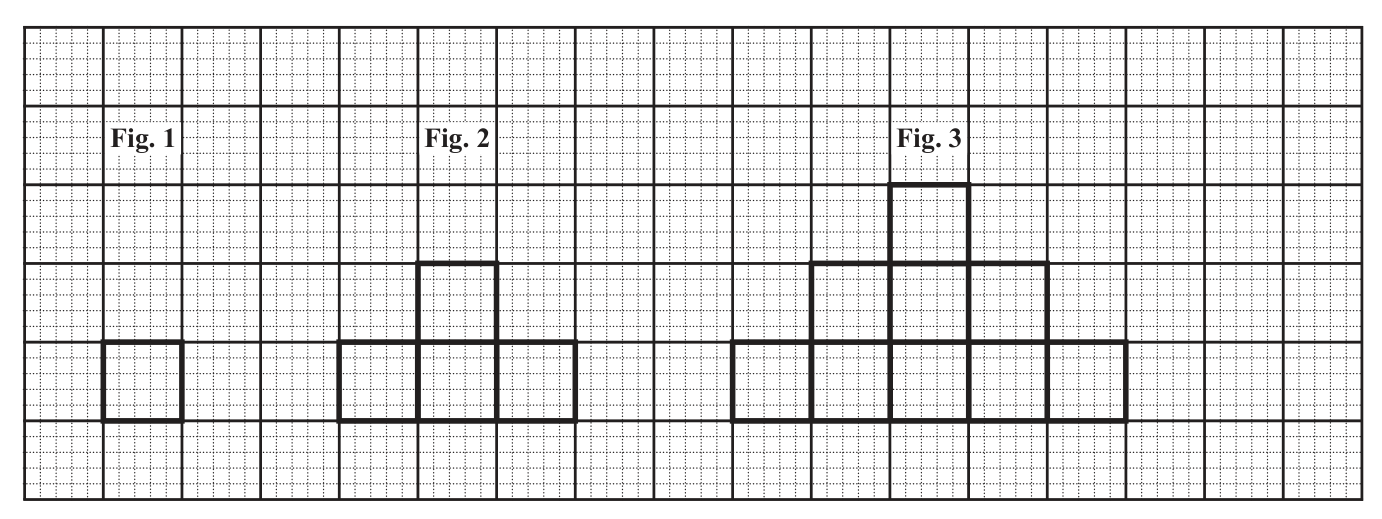
The diagram below shows the first three figures in a sequence of figures. Each figure is made up of squares of side 1 cm.
On your answer sheet, draw the FOURTH figure (Fig. 4) in the sequence.
[2 marks]
Study the patterns in the table shown below, and on the answer sheet provided, complete the rows numbered (i), (ii), (iii) and (iv).
4
[2 marks]
5
[2 marks]
15
[2 marks]
n
[2 marks]
SECTION II ALGEBRA AND RELATIONS, FUNCTIONS AND GRAPHS
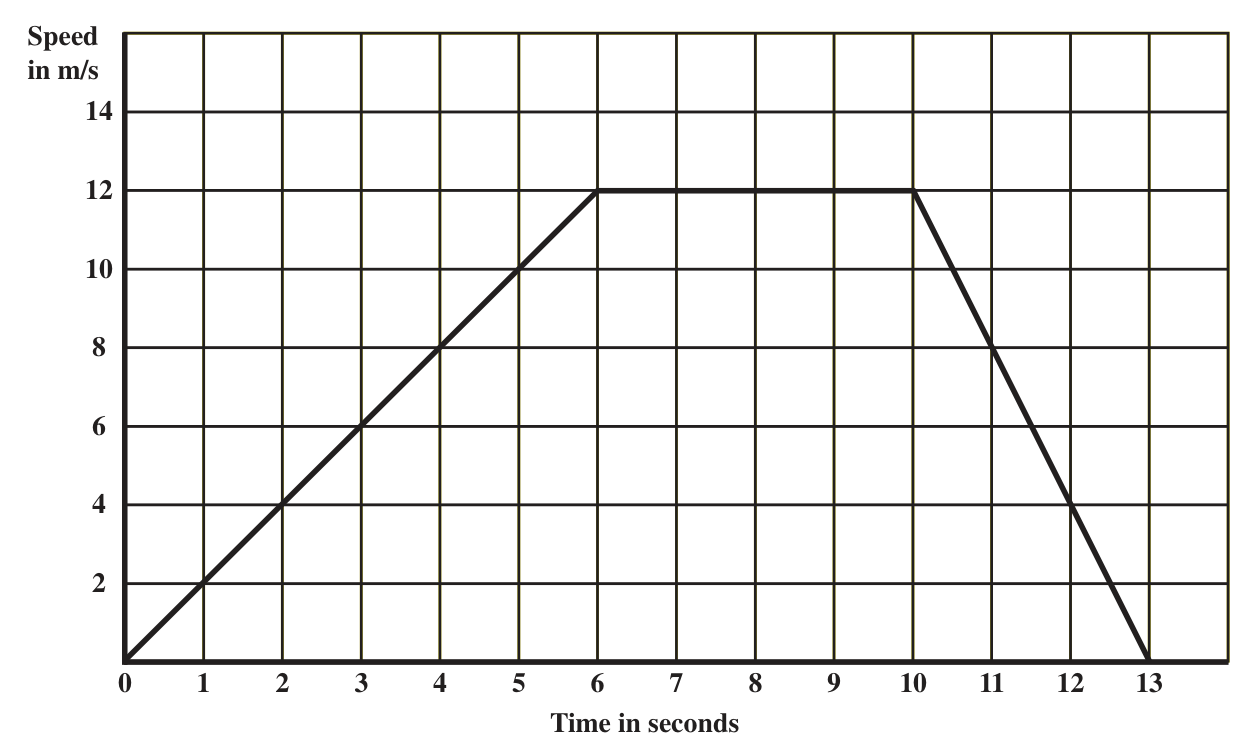
The diagram below shows the speed-time graph of the motion of an athlete during a race.
(i) Using the graph, determine a) the MAXIMUM speed b) the number of seconds for which the speed was constant c) the TOTAL distance covered by the athlete during the race. (ii) During which time-period of the race was a) the speed of the athlete increasing b) the speed of the athlete decreasing c) the acceleration of the athlete zero? (b) A farmer supplies his neighbours with pumpkins and melons daily, using the following conditions: First condition : Second condition : Third condition : the total number of pumpkins and melons must not exceed 12. (i) Write an inequality to represent the THIRD condition. (ii) Using a scale of 1 cm to represent one pumpkin on the x-axis and 1 cm to represent one melon on the y-axis, draw the graphs of the THREE lines associated with the THREE inequalities. (iii) Identify, by shading, the region which satisfies the THREE inequalities. (iv) Determine, from your graph, the minimum values of and which satisfy the conditions.
[15 marks]
The diagram below shows the speed-time graph of the motion of an athlete during a race.
(i) Using the graph, determine a) the MAXIMUM speed b) the number of seconds for which the speed was constant c) the TOTAL distance covered by the athlete during the race. (ii) During which time-period of the race was a) the speed of the athlete increasing b) the speed of the athlete decreasing c) the acceleration of the athlete zero?
[7 marks]
Using the graph, determine a) the MAXIMUM speed b) the number of seconds for which the speed was constant c) the TOTAL distance covered by the athlete during the race.
[4 marks]
During which time-period of the race was a) the speed of the athlete increasing b) the speed of the athlete decreasing c) the acceleration of the athlete zero?
[3 marks]
A farmer supplies his neighbours with pumpkins and melons daily, using the following conditions: First condition : Second condition : Third condition : the total number of pumpkins and melons must not exceed 12. (i) Write an inequality to represent the THIRD condition. (ii) Using a scale of 1 cm to represent one pumpkin on the x-axis and 1 cm to represent one melon on the y-axis, draw the graphs of the THREE lines associated with the THREE inequalities. (iii) Identify, by shading, the region which satisfies the THREE inequalities. (iv) Determine, from your graph, the minimum values of and which satisfy the conditions.
Write an inequality to represent the THIRD condition.
[1 mark]
Using a scale of 1 cm to represent one pumpkin on the x-axis and 1 cm to represent one melon on the y-axis, draw the graphs of the THREE lines associated with the THREE inequalities.
[4 marks]
Identify, by shading, the region which satisfies the THREE inequalities.
[1 mark]
Determine, from your graph, the minimum values of and which satisfy the conditions.
[2 marks]
MEASUREMENT, GEOMETRY AND TRIGONOMETRY
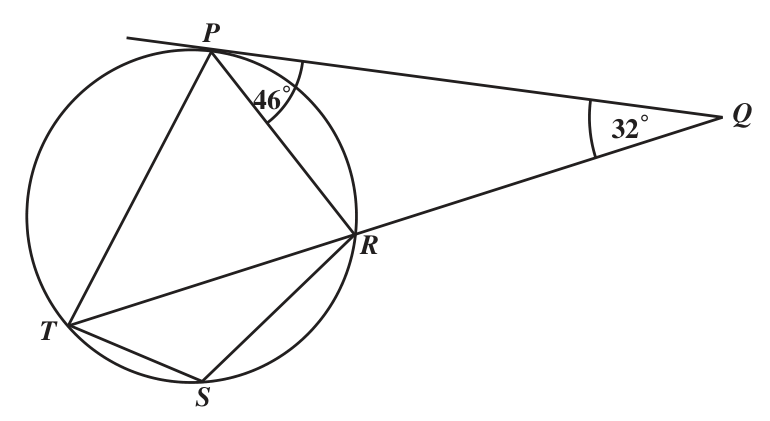
(a) In the diagram below, not drawn to scale, is a tangent to the circle , so that , and is a straight line.
Calculate, giving a reason for EACH step of your answer, (i) (ii) (iii) . (b) The diagram below, not drawn to scale, shows a vertical flagpole, , with its foot, , on the horizontal plane . and are wires which support the flagpole in its position. The angle of elevation of from is , m, m and .
Calculate, giving your answer correct to 3 significant figures (i) the height, , of the flagpole (ii) the length of (iii) the angle of elevation of from .
[15 marks]
In the diagram below, not drawn to scale, is a tangent to the circle , so that , and is a straight line.
[2 marks]
[2 marks]
.
[3 marks]
The diagram below, not drawn to scale, shows a vertical flagpole, , with its foot, , on the horizontal plane . and are wires which support the flagpole in its position. The angle of elevation of from is , m, m and .
the height, , of the flagpole
[2 marks]
the length of
[3 marks]
the angle of elevation of from .
[3 marks]
VECTORS AND MATRICES
[15 marks]
and are two matrices such that and .
(i) Find . (ii) Determine , the inverse of . (iii) Given that , write as the product of TWO matrices. (iv) Hence, calculate the values of and .
[10 marks]
Find .
[2 marks]
Determine , the inverse of .
[1 mark]
Given that , write as the product of TWO matrices.
Hence, calculate the values of and .
[2 marks]
The diagram below, not drawn to scale, shows triangle .
and are points on and respectively, such that and .
Copy the diagram in your answer booklet and show the points and .
[2 marks]
Given that and , write in terms of and , an expression for a) b) c) .
Using your findings in (b) (ii), deduce TWO geometrical relationships between and .
[2 marks]
[5 marks]
Calculate (i) the length of (ii) the length of (iii) the area of the face .
[6 marks]
(ii) Measure and state a) the length of b) the size of .
[7 marks]
Use the graph above to determine (i) the scale used on the x-axis (ii) the value of for which (iii) the values of for which (iv) the range of values of , giving your answer in the form , where and are real numbers.
[9 marks]
[2 marks]
[8 marks]
Calculate, giving a reason for EACH step of your answer, (i) (ii) (iii) .
[7 marks]
Calculate, giving your answer correct to 3 significant figures (i) the height, , of the flagpole (ii) the length of (iii) the angle of elevation of from .
[8 marks]
[2 marks]
(i) Copy the diagram in your answer booklet and show the points and . (ii) Given that and , write in terms of and , an expression for a) b) c) . (iii) Using your findings in (b) (ii), deduce TWO geometrical relationships between and .
[5 marks]
[4 marks]