CSEC Geography Paper 3 May/June 2005 - Free CXC Past Paper with Answers
Free CXC Geography Paper 3 May/June 2005 past paper from 2005. Includes a worked answer key. Open the PDF, take a timed test, and study with AI on Caribbean AI.
Answer keys are free on Caribbean AI. View the answers to every past-paper question at no cost - no payment needed - with step-by-step worked solutions and instant AI marking available on Premium.
- All CSEC Past Papers
- CSEC Geography Past Papers
- CSEC Geography Paper 3 May/June 2015
- CSEC Geography Paper 3 May/June 2014
- CSEC Geography Paper 3 May/June 2013
- CSEC Geography Paper 3 May/June 2012
- CSEC Geography Paper 3 May/June 2011
- CSEC Geography Paper 3 May/June 2010
- CSEC Geography Paper 3 May/June 2009
- CSEC Geography Paper 3 May/June 2008
- CSEC Geography Paper 3 May/June 2007
- CSEC Geography Paper 3 May/June 2006
CSEC Geography Paper 3 May/June 2005 - Free CXC Past Paper with Answers
Free CXC Geography Paper 3 May/June 2005 past paper from 2005. Includes a worked answer key. Open the PDF, take a timed test, and study with AI on Caribbean AI.
Opening the interactive papers…
- All CSEC Past Papers
- CSEC Geography Past Papers
- CSEC Geography Paper 3 May/June 2015
- CSEC Geography Paper 3 May/June 2014
- CSEC Geography Paper 3 May/June 2013
- CSEC Geography Paper 3 May/June 2012
- CSEC Geography Paper 3 May/June 2011
- CSEC Geography Paper 3 May/June 2010
- CSEC Geography Paper 3 May/June 2009
- CSEC Geography Paper 3 May/June 2008
- CSEC Geography Paper 3 May/June 2007
- CSEC Geography Paper 3 May/June 2006
CSEC Geography Paper 3 May/June 2005 Questions
Every question from this paper as text. See the answers and worked solutions. Questions are the property of the Caribbean Examinations Council; Caribbean AI is not affiliated with CXC.
Question 1 (7 marks)
Use the map extract provided (Kingston, Jamaica - Scale 1 : 50 000) to draw a small sketch map of Jamaica in the space allocated for Figure 1.

On the sketch map that you have drawn in Figure 1, show the position of a) the city of Kingston b) the Mineral Bath at grid reference 780 460.
[3 marks]
In the grid provided in Figure 2, draw a sketch map of the coast using a scale of 1 : 50 000 to show the location of the Mineral Bath in relation to the main roads, a quarry, the built-up areas (Kingston and Harbour View) and Long Mountain. [Note that the grid is bounded by Eastings 75 and 82, and Northings 43 and 48]
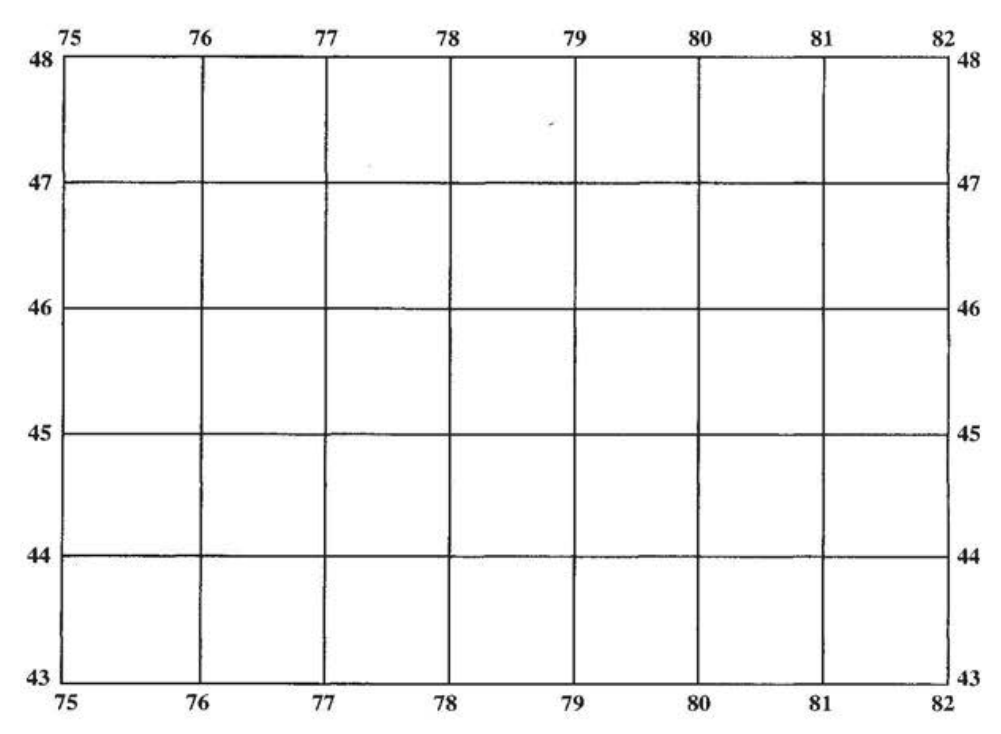
[4 marks]
Question 2 (2 marks)
Suppose you were told that most of the patrons using the Mineral Bath in August are men over 30 years old from the United States of America. Frame a research question for a study you can conduct to test the accuracy of that statement.