CSEC Geography Paper 3 May/June 2008 - Free CXC Past Paper with Answers
Free CXC Geography Paper 3 May/June 2008 past paper from 2008. Includes a worked answer key. Open the PDF, take a timed test, and study with AI on Caribbean AI.
Answer keys are free on Caribbean AI. View the answers to every past-paper question at no cost - no payment needed - with step-by-step worked solutions and instant AI marking available on Premium.
- All CSEC Past Papers
- CSEC Geography Past Papers
- CSEC Geography Paper 3 May/June 2015
- CSEC Geography Paper 3 May/June 2014
- CSEC Geography Paper 3 May/June 2013
- CSEC Geography Paper 3 May/June 2012
- CSEC Geography Paper 3 May/June 2011
- CSEC Geography Paper 3 May/June 2010
- CSEC Geography Paper 3 May/June 2009
- CSEC Geography Paper 3 May/June 2007
- CSEC Geography Paper 3 May/June 2006
- CSEC Geography Paper 3 May/June 2005
CSEC Geography Paper 3 May/June 2008 - Free CXC Past Paper with Answers
Free CXC Geography Paper 3 May/June 2008 past paper from 2008. Includes a worked answer key. Open the PDF, take a timed test, and study with AI on Caribbean AI.
Opening the interactive papers…
- All CSEC Past Papers
- CSEC Geography Past Papers
- CSEC Geography Paper 3 May/June 2015
- CSEC Geography Paper 3 May/June 2014
- CSEC Geography Paper 3 May/June 2013
- CSEC Geography Paper 3 May/June 2012
- CSEC Geography Paper 3 May/June 2011
- CSEC Geography Paper 3 May/June 2010
- CSEC Geography Paper 3 May/June 2009
- CSEC Geography Paper 3 May/June 2007
- CSEC Geography Paper 3 May/June 2006
- CSEC Geography Paper 3 May/June 2005
CSEC Geography Paper 3 May/June 2008 Questions
Every question from this paper as text. See the answers and worked solutions. Questions are the property of the Caribbean Examinations Council; Caribbean AI is not affiliated with CXC.
Question 1 (4 marks)
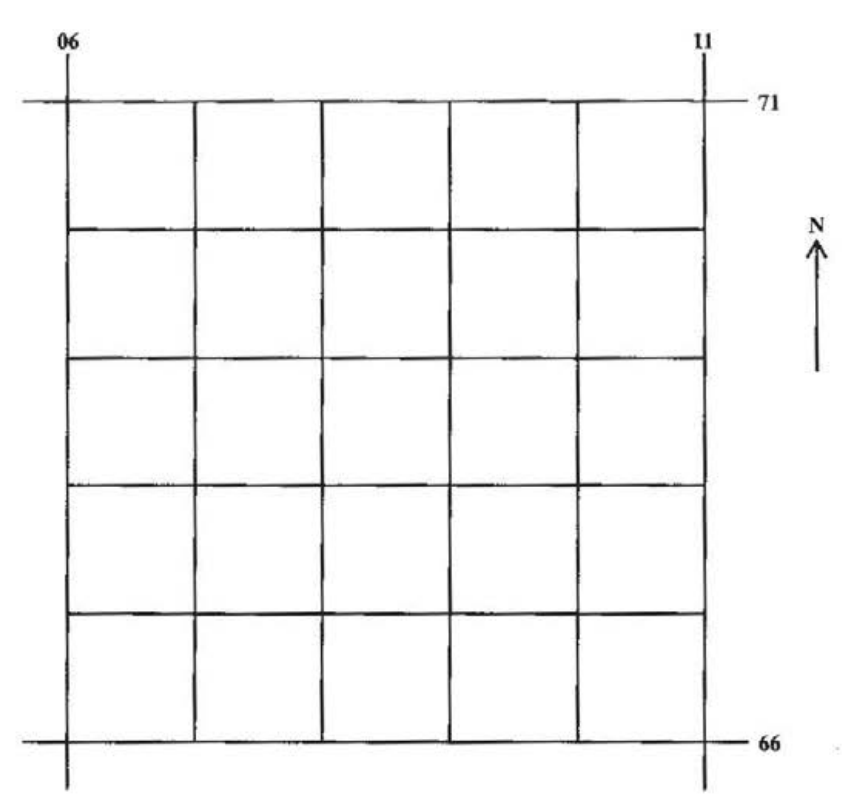
Use the grid provided in Figure 1 to draw a sketch map showing Port Antonio at the same scale. The area is bordered by Eastings 06 and 11 and Northings 66 and 71.
On the sketch map, insert
[4 marks]
the coastline
[1 mark]
the Class B road
[1 mark]
the East Town River
[1 mark]
the West Town River and
[1 mark]
shade the built-up area of Port Antonio.