CSEC Geography Paper 3 May/June 2011 - Free CXC Past Paper with Answers
Free CXC Geography Paper 3 May/June 2011 past paper from 2011. Includes a worked answer key. Open the PDF, take a timed test, and study with AI on Caribbean AI.
Answer keys are free on Caribbean AI. View the answers to every past-paper question at no cost - no payment needed - with step-by-step worked solutions and instant AI marking available on Premium.
- All CSEC Past Papers
- CSEC Geography Past Papers
- CSEC Geography Paper 3 May/June 2015
- CSEC Geography Paper 3 May/June 2014
- CSEC Geography Paper 3 May/June 2013
- CSEC Geography Paper 3 May/June 2012
- CSEC Geography Paper 3 May/June 2010
- CSEC Geography Paper 3 May/June 2009
- CSEC Geography Paper 3 May/June 2008
- CSEC Geography Paper 3 May/June 2007
- CSEC Geography Paper 3 May/June 2006
- CSEC Geography Paper 3 May/June 2005
CSEC Geography Paper 3 May/June 2011 - Free CXC Past Paper with Answers
Free CXC Geography Paper 3 May/June 2011 past paper from 2011. Includes a worked answer key. Open the PDF, take a timed test, and study with AI on Caribbean AI.
Opening the interactive papers…
- All CSEC Past Papers
- CSEC Geography Past Papers
- CSEC Geography Paper 3 May/June 2015
- CSEC Geography Paper 3 May/June 2014
- CSEC Geography Paper 3 May/June 2013
- CSEC Geography Paper 3 May/June 2012
- CSEC Geography Paper 3 May/June 2010
- CSEC Geography Paper 3 May/June 2009
- CSEC Geography Paper 3 May/June 2008
- CSEC Geography Paper 3 May/June 2007
- CSEC Geography Paper 3 May/June 2006
- CSEC Geography Paper 3 May/June 2005
CSEC Geography Paper 3 May/June 2011 Questions
Every question from this paper as text. See the answers and worked solutions. Questions are the property of the Caribbean Examinations Council; Caribbean AI is not affiliated with CXC.
Question 1 (4 marks)
Use the grid provided in Figure 1 to draw a sketch map showing the site of Placentia Village. The grid is at the same scale as the map and is bordered by Eastings 52 and 56 and Northings 25 and 33. Part of the coastline has been inserted.
On the grid, (i) complete the coastline (ii) label Placentia Lagoon (iii) insert Placentia Village and Seine Bright Village (iv) insert the areas of swamp and broken or light forest.
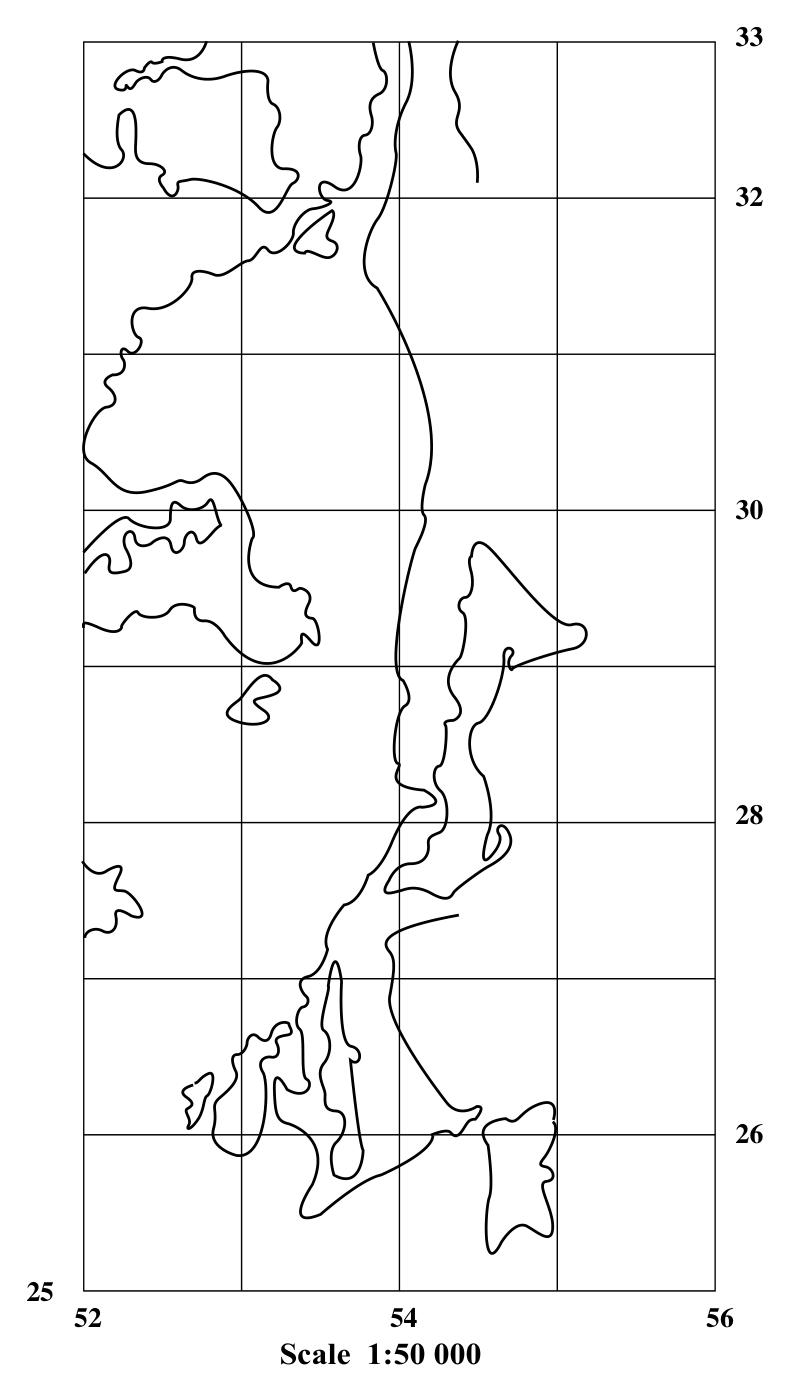
[4 marks]
Question 2 (2 marks)
You are doing research on the awareness of climate change and the impact of rising sea level on coastal villages in the area shown on the map provided. Frame a research question or statement which will guide the collection of data in the field.
[2 marks]
Question 3 (14 marks)
List SIX types of data which you would record in the field.
[6 marks]
Describe how and when you would conduct the research and record the data.