(c)(i) 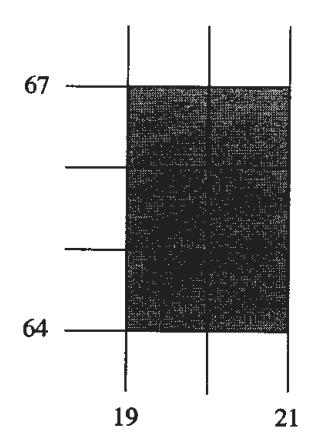
Identify the landform along the coast.
[1 mark]
Free CXC Geography Paper 2 May/June 2008 past paper from 2008. Includes a worked answer key. Open the PDF, take a timed test, and study with AI on Caribbean AI.
Answer keys are free on Caribbean AI. View the answers to every past-paper question at no cost - no payment needed - with step-by-step worked solutions and instant AI marking available on Premium.
CSEC Geography Paper 2 May/June 2008 - Free CXC Past Paper with Answers
Free CXC Geography Paper 2 May/June 2008 past paper from 2008. Includes a worked answer key. Open the PDF, take a timed test, and study with AI on Caribbean AI.
Opening the interactive papers…
Every question from this paper as text. See the answers and worked solutions. Questions are the property of the Caribbean Examinations Council; Caribbean AI is not affiliated with CXC.
What is the six-figure grid reference of the junction of the Class B and Class C roads near the coast in Port Antonio?
[2 marks]
Using the line scale, determine the length of the road (along the coast of East Harbour) from the junction of the Class B and Class C roads used in (i) to the junction of the road to Folly Point. Give your answer in kilometres and metres to the NEAREST 100 metres.
[2 marks]
Measure the bearing from the lighthouse at Folly Point to the rock on the north coast called Ship Rock (near Easting 04).
[2 marks]
Determine the approximate compass direction of the hotel at Daniels Harbour (near Easting 11) from the Folly Point Lighthouse.
[1 mark]
provided as an insert is a grid for a cross-section across the valley of the Rio Grande along Northing 67, between Eastings 03 and 06 at the same horizontal scale as the map. Using the map as a guide, sketch the cross-section on the grid and insert and label the position of the river.
[3 marks]
Study the area on the map, as shown below, enclosed by Eastings 19 and 21, and Northings 64 and 67.
[3 marks]
Identify the landform along the coast.
[1 mark]
List the THREE types of agricultural land use shown in the area.
[3 marks]
Describe the distribution of banana plantations in the area covered by the map extract.
[4 marks]
Select TWO of the following settlement patterns and describe their distribution south of Northing 65.
[4 marks]
Compare THREE features of the drainage west of the Rio Grande with the area to the east of it. [Refer to the entire area of the map extract.]
[6 marks]
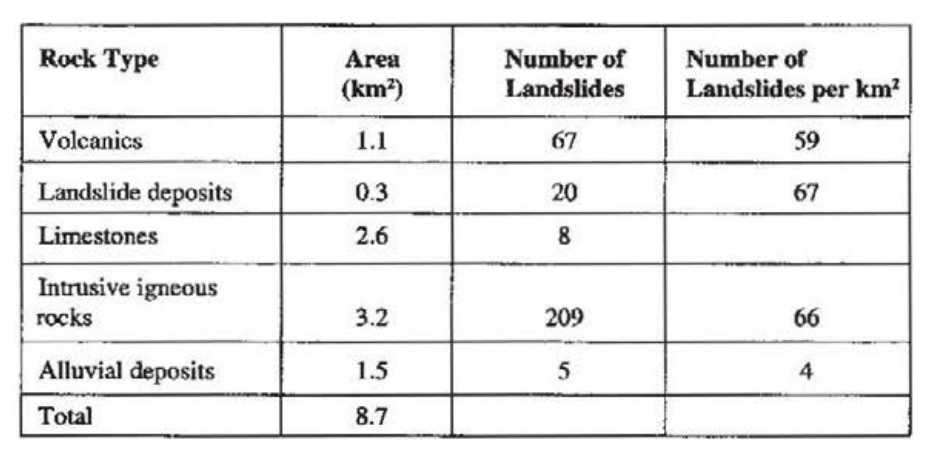
Study Table 1 which shows slope failures recorded for different rock types and then answer the questions that follow.
| Rock Type | Area () | Number of Landslides | Number of Landslides per |
|---|---|---|---|
| Volcanics | 1.1 | 67 | 59 |
| Landslide deposits | 0.3 | 20 | 67 |
| Limestones | 2.6 | 8 | |
| Intrusive igneous rocks | 3.2 | 209 | 66 |
| Alluvial deposits | 1.5 | 5 | 4 |
| Total | 8.7 |
How many landslides were recorded?
[1 mark]
Which rock type had the HIGHEST number of landslides?
[1 mark]
Calculate the number of landslides per square kilometre on limestones.
[1 mark]
State the number of landslides that occurred on the rock type with the SMALLEST area.
[1 mark]
Identify TWO landforms that are formed at plate boundaries.
[2 marks]
Describe what happens at divergent and convergent plate boundaries.
[6 marks]
Explain how and why the shape of the cross-section of a river valley differs in its upper and lower courses.
[4 marks]
With the aid of FULLY annotated diagrams explain how spits and tombolos are formed.
[8 marks]
Draw a well-labelled diagram to show THREE main features of a meander.
[4 marks]
State FOUR conditions that are required for the successful growth of coral reefs.
[4 marks]
Describe fringing reefs and barrier reefs.
[4 marks]
Account for the formation of
waterfalls
[6 marks]
deltas.
[6 marks]
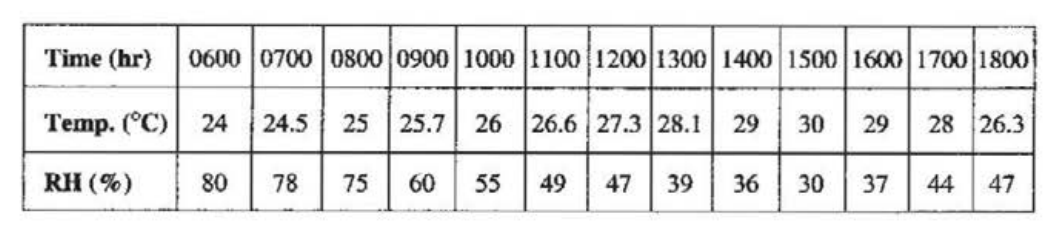
Study Table 2 which shows the temperature () and relative humidity (RH%) for a Caribbean island between 6 a.m. and 6 p.m. and answer the questions below.
| Time (hr) | 0600 | 0700 | 0800 | 0900 | 1000 | 1100 | 1200 | 1300 | 1400 | 1500 | 1600 | 1700 | 1800 |
|---|---|---|---|---|---|---|---|---|---|---|---|---|---|
| Temp. () | 24 | 24.5 | 25 | 25.7 | 26 | 26.6 | 27.3 | 28.1 | 29 | 30 | 29 | 28 | 26.3 |
| RH (%) | 80 | 78 | 75 | 60 | 55 | 49 | 47 | 39 | 36 | 30 | 37 | 44 | 47 |
Between which TWO hours did the temperature start to decrease?
[1 mark]
At what time was the HIGHEST relative humidity observed?
[1 mark]
State the relationship between temperature and relative humidity.
[2 marks]
What are 'tropical waves'?
[2 marks]
Describe the characteristics of THREE elements of the weather associated with the passage of a tropical wave.
[6 marks]
An answer sheet is provided for this question. Complete Table 3 on the answer sheet to compare the adaptations of trees to the climate in equatorial and tropical continental regions.
Give ONE adaptation in EACH case.
[12 marks]
Draw a sketch map of a Caribbean country that you have studied and on it indicate ONE area of dense settlement and ONE area of sparse settlement.
[4 marks]
Define the term 'urbanization'.
[2 marks]
Explain how urbanization occurs in the Caribbean. Include THREE causes in your response.
[9 marks]
Discuss ONE negative effect of urbanization in ONE named capital city in the Caribbean.
[3 marks]
Outline THREE measures aimed at controlling urbanization in the Caribbean.
[6 marks]
The value (in thousand dollars) of the gross domestic products for selected sectors in Country X is presented in Table 4.
| Sector | GDP ($Thousand) |
|---|---|
| Agriculture | 13 500 |
| Manufacturing | 32 500 |
| Services | 170 700 |
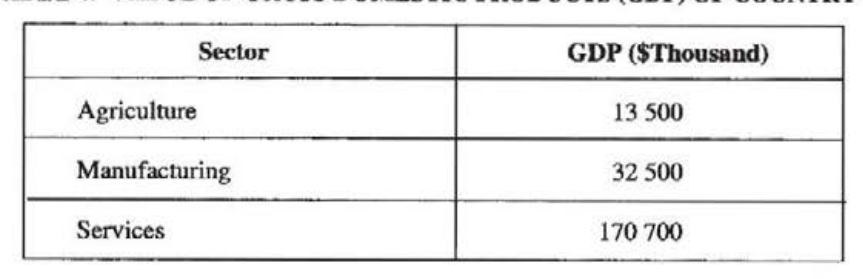
Draw a pie chart (diameter 4 cms) to illustrate the data presented in Table 4.
[4 marks]
Define the term 'economic activity'.
[2 marks]
For ONE type of economic activity you have studied, describe THREE changes that have taken place.
[6 marks]
Explain THREE challenges faced by any TWO types of economic activity in the Caribbean.
[12 marks]
Figure 2 is provided as an insert for this question. Table 5 presents data on the value of agricultural exports from Country X.
| Year | 2001 | 2002 | 2003 | 2004 |
|---|---|---|---|---|
| Value ($ '000) | 151 700 | 138 000 | 150 500 | 147 000 |
Using the axes provided in Figure 2, draw a bar graph to illustrate the data. Label your graph appropriately.

[4 marks]
Define the term 'agriculture'.
[2 marks]
Describe THREE ways in which agriculture is important to the Caribbean.
[6 marks]
Compare 'peasant farming' and 'commercial arable farming' in a named Caribbean country using the following headings:
[12 marks]
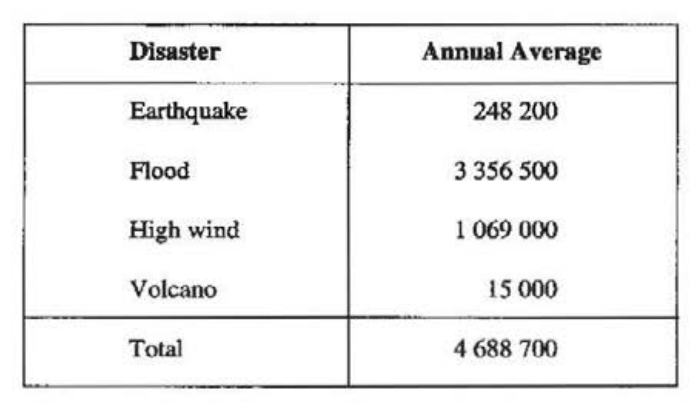
Study Table 6 which provides data on the annual average number of people made homeless by natural disasters from 1972 to 1976 and answer the questions that follow.
| Disaster | Annual Average |
|---|---|
| Earthquake | 248 200 |
| Flood | 3 356 500 |
| High wind | 1 069 000 |
| Volcano | 15 000 |
| Total | 4 688 700 |
For the period 1972 to 1976,
[4 marks]
how many persons were made homeless by volcanoes annually?
[1 mark]
what is the average number of persons who were affected by climatic disasters annually?
[2 marks]
what was the annual percentage of persons homeless from natural disasters as a result of high winds?
[1 mark]
For a country you have studied describe FOUR ways in which EITHER an earthquake, OR a volcanic eruption, OR a hurricane affected life or property.
[8 marks]
For EITHER a hurricane, OR an earthquake, OR a volcano explain how EACH of THREE precautions can be used to reduce its impact.
[12 marks]
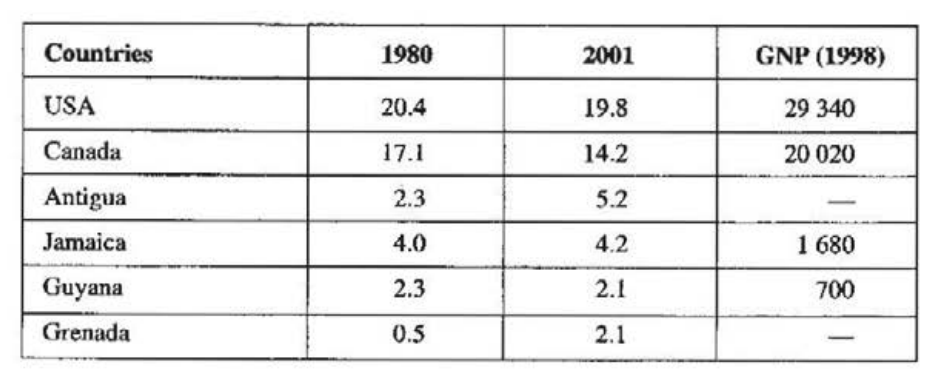
Study Table 7 which shows carbon dioxide emissions per person and GNP per capita for selected countries and answer the questions below.
| Countries | 1980 | 2001 | GNP (1998) |
|---|---|---|---|
| USA | 20.4 | 19.8 | 29 340 |
| Canada | 17.1 | 14.2 | 20 020 |
| Antigua | 2.3 | 5.2 | — |
| Jamaica | 4.0 | 4.2 | 1 680 |
| Guyana | 2.3 | 2.1 | 700 |
| Grenada | 0.5 | 2.1 | — |
Sources: Wilson, 2004 and Collins-Longman Atlas, 2002
[4 marks]
Which country had the SMALLEST increase in carbon dioxide emissions per person between 1980 and 2001?
[1 mark]
Calculate the change in carbon dioxide emissions per person for Canada.
[2 marks]
State the relationship between carbon dioxide emissions and the GNP per capita of the countries.
[1 mark]
Define the term 'air pollution'.
[2 marks]
Describe THREE causes of river pollution in a named Caribbean country.
[6 marks]
Explain how TWO measures that have been implemented by Caribbean countries can reduce EACH of the following:
[12 marks]
Study Figure 3 which shows the differences in the average annual temperature from 1900 to 2000 and answer the questions that follow.
[24 marks]
Determine the difference in average annual temperature from the 1900 average in a) 2000 b) 1910. During which quarter (1900-1925, 1925-1950, 1950-1975 or 1975-2000) was the change in average annual temperature a) fastest? b) smallest?
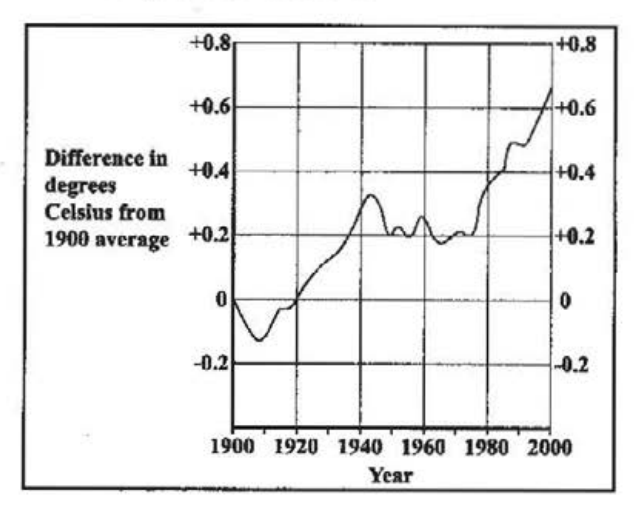
Determine the difference in average annual temperature from the 1900 average in a) 2000 b) 1910.
During which quarter (1900-1925, 1925-1950, 1950-1975 or 1975-2000) was the change in average annual temperature a) fastest? b) smallest?
Describe the process which produces the greenhouse effect.
[4 marks]
For any TWO greenhouse gases describe how the concentration of EACH increases in the atmosphere.
[4 marks]
Using examples from a developed country, explain how TWO measures can reduce the production of greenhouse gases.
[6 marks]
Compare THREE possible consequences of global warming in the Maldives or Mauritius with those in a named Caribbean country.
[6 marks]
