CSEC Biology Paper 2 May/June 2007 - Free CXC Past Paper with Answers
Free CXC Biology Paper 2 May/June 2007 past paper from 2007. Includes a worked answer key. Open the PDF, take a timed test, and study with AI on Caribbean AI.
Answer keys are free on Caribbean AI. View the answers to every past-paper question at no cost - no payment needed - with step-by-step worked solutions and instant AI marking available on Premium.
- All CSEC Past Papers
- CSEC Biology Past Papers
- CSEC Biology Paper 2 May/June 2026
- CSEC Biology Paper 2 May/June 2025
- CSEC Biology Paper 2 January 2025
- CSEC Biology Paper 2 May/June 2024
- CSEC Biology Paper 2 January 2024
- CSEC Biology Paper 2 May/June 2023
- CSEC Biology Paper 2 January 2023
- CSEC Biology Paper 2 May/June 2022
- CSEC Biology Paper 2 May/June 2021
- CSEC Biology Paper 2 January 2021
- CSEC Biology Paper 2 May/June 2020
- CSEC Biology Paper 2 January 2020
- CSEC Biology Paper 2 May/June 2019
- CSEC Biology Paper 2 January 2019
- CSEC Biology Paper 2 May/June 2018
- CSEC Biology Paper 2 January 2018
- CSEC Biology Paper 2 January 2017
- CSEC Biology Paper 2 May/June 2017
- CSEC Biology Paper 2 May/June 2016
- CSEC Biology Paper 2 May/June 2015
- CSEC Biology Paper 2 January 2015
- CSEC Biology Paper 2 May/June 2014
- CSEC Biology Paper 2 May/June 2013
- CSEC Biology Paper 2 May/June 2012
- CSEC Biology Paper 2 May/June 2011
- CSEC Biology Paper 2 May/June 2010
- CSEC Biology Paper 2 May/June 2009
- CSEC Biology Paper 2 January 2008
- CSEC Biology Paper 2 May/June 2008
- CSEC Biology Paper 2 January 2007
- CSEC Biology Paper 2 May/June 2006
- CSEC Biology Paper 2 May/June 2005
CSEC Biology Paper 2 May/June 2007 - Free CXC Past Paper with Answers
Free CXC Biology Paper 2 May/June 2007 past paper from 2007. Includes a worked answer key. Open the PDF, take a timed test, and study with AI on Caribbean AI.
Opening the interactive papers…
- All CSEC Past Papers
- CSEC Biology Past Papers
- CSEC Biology Paper 2 May/June 2026
- CSEC Biology Paper 2 May/June 2025
- CSEC Biology Paper 2 January 2025
- CSEC Biology Paper 2 May/June 2024
- CSEC Biology Paper 2 January 2024
- CSEC Biology Paper 2 May/June 2023
- CSEC Biology Paper 2 January 2023
- CSEC Biology Paper 2 May/June 2022
- CSEC Biology Paper 2 May/June 2021
- CSEC Biology Paper 2 January 2021
- CSEC Biology Paper 2 May/June 2020
CSEC Biology Paper 2 May/June 2007 Questions
Every question from this paper as text. See the answers and worked solutions. Questions are the property of the Caribbean Examinations Council; Caribbean AI is not affiliated with CXC.
Question 1 (24 marks)
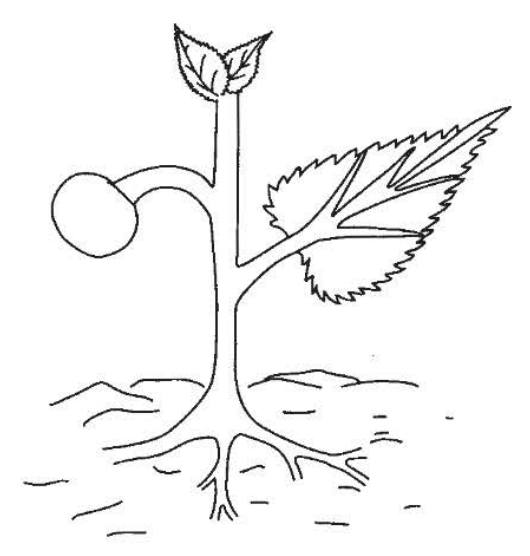
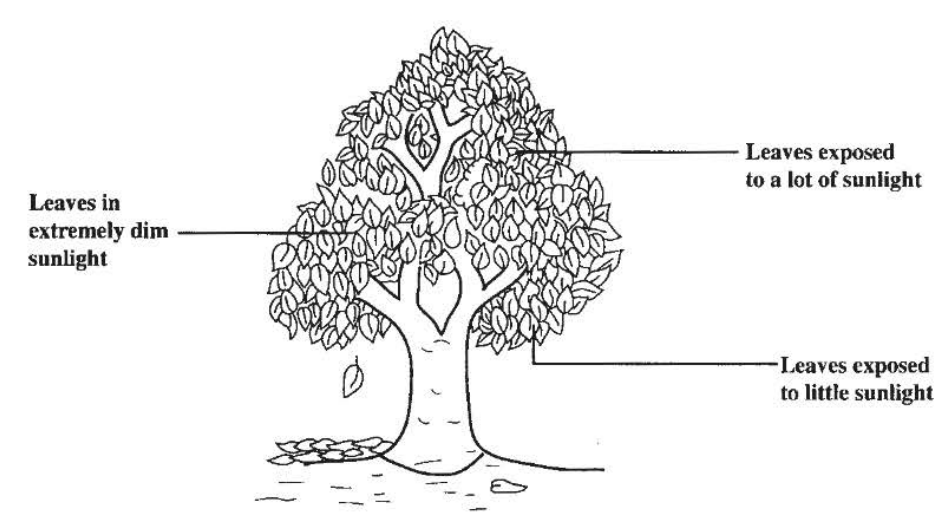
Students in a Biology class wish to test the hypothesis that all leaves on a tree photosynthesize at the same rate. They select leaves from a tree similar to that illustrated in Figure 1.
Figure 1. Diagram of a tree displaying its canopy
Describe how the students may investigate the hypothesis. Include in your description any apparatus/materials required.
Apparatus/materials:
Method:
[6 marks]
Write an aim for the investigation.
[2 marks]
Suggest ONE precaution the students should take in their investigation.
[1 mark]
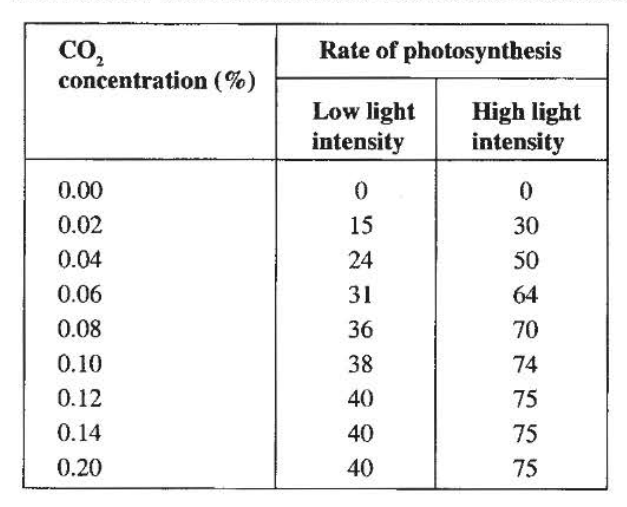
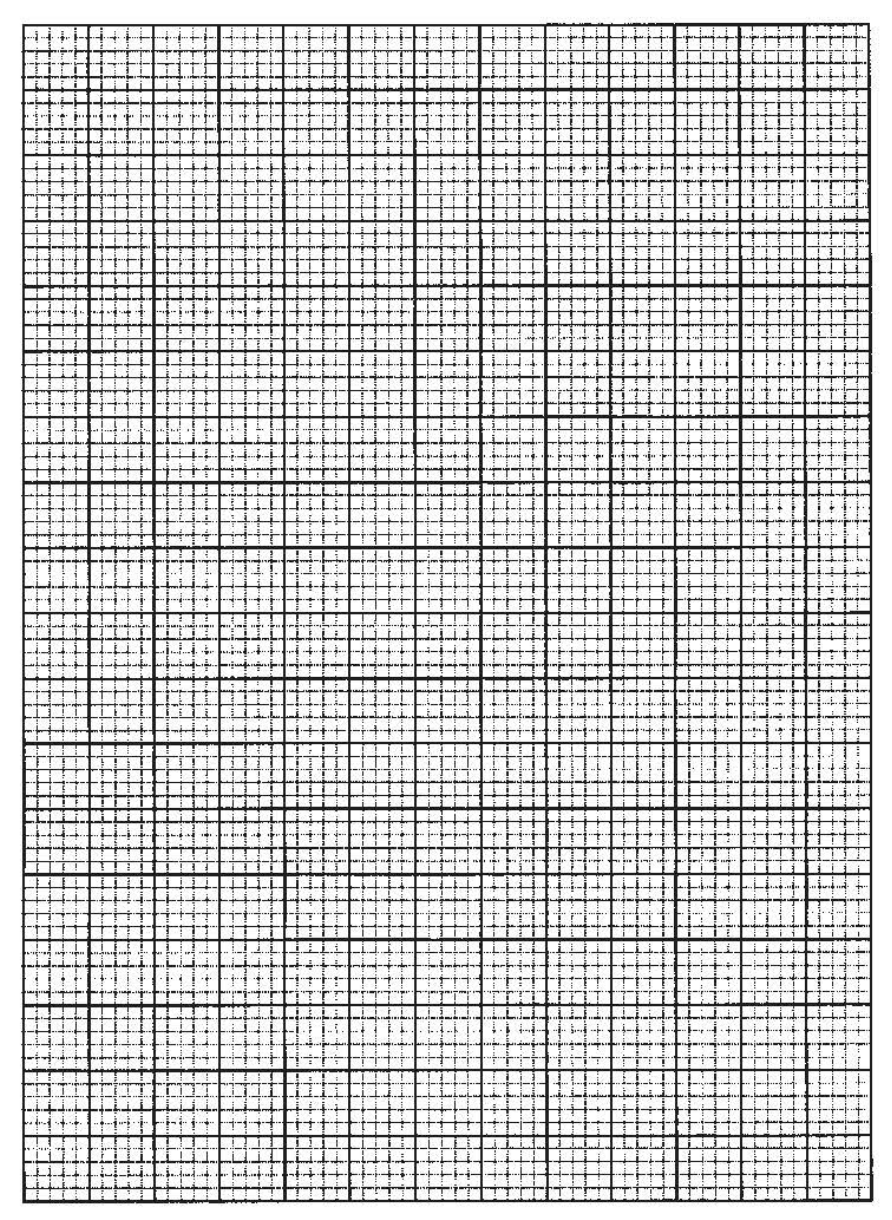
Table 1 below shows the effect of carbon dioxide concentration on the rate of photosynthesis at two different light intensities.
TABLE 1: EFFECT OF CARBON DIOXIDE ON PHOTOSYNTHESIS
| concentration (%) |
|---|